Gold's refreshed immediate-term TRADE risk range is $1285-$1336 with intermediate-term upside to TREND resistance at $1381.
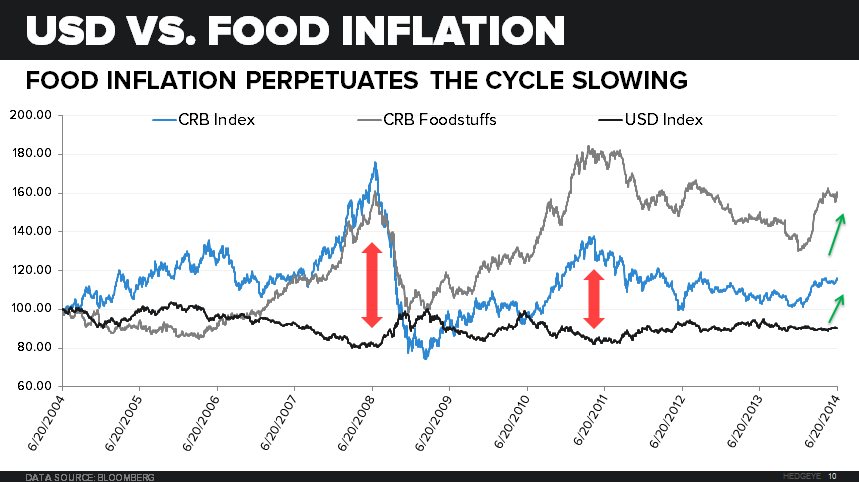
With the +3.4% gain week-over-week the consumer is lucky he won't be eating gold at the dinner table this weekend. Unfortunately, the CRB food index appreciated +3.10% to +22.8% YTD.
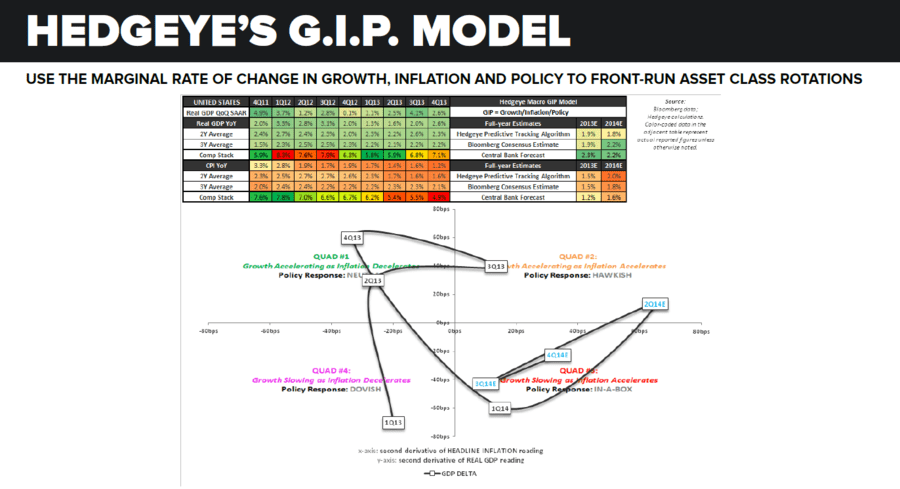
The repetitive call to front-run the Fed’s response to worse-than expected data undoubtedly manifest this week:
- Headline CPI on Tuesday printed +0.4% vs. +0.2% expected (inflation accelerating)
- Full-year GDP forecast from the Fed downwardly revised for the SEVENTH year in a row (growth slowing):
- 2.1-2.3% from 3.0% (predictable response)
- 2015 estimates held constant (possibly foreshadowing an 8th year?)
As inflation accelerates, and growth expectations decrease, the likelihood of an easier fed increases. We believe Thursday’s session was anything but coincidental:
- Gold Surges 3.44%
- Spot Volumes: 62%, 52%, and 49% above 1, 3, and 6-Month averages respectively
- The 1-Week negative correlation tightens significantly to -0.91.
- The 1, 3, and 6-month correlations have remained in the -0.60s from the March top in the Euro

Divergences in the equity market between consumer-based growth and inflationary sectors continues:
- XLE (+13.5% YTD); XLU (+14.9%)
- XLY (-1.00%)
- SPX (+6.1%)

American consumption habits remain the driving force in our economy. Open-ended discussions on the flow through from fed policy, to credit growth, to spending are regularities on our team. We are continuously stuck with the assumptions from central planners:
Last ten Years:
- Trailing 1-year personal savings rate: -9.0%
- Median consumer net income margins have decreased over last 5 years of data availability (Net Income % After-Tax Earnings--> BLS PCE survey):
- 2008: 1.88%
- 2009: 1.94%
- 2010: 1.94%
- 2011: 1.61%
- 2012: 1.38%
- U.S. Private Sector Real Hourly Earnings Growth (Y/Y % Change): -43.7%
- USD Index: -10.0%
- CRB Index: +16.44% (+11.7% YTD)

Unfortunately U.S. dollar devaluation and commodity inflation require fiscal subsidization when the wealth effect does not flow-through in the assumed capacity. Sure, the top 20% with the opportunity to own fixed assets and chase inflation in stock and commodity markets continue to take a larger portion of the total "wealth creation" from interest, dividends and property related income. This increase in wealth would arguably induce more spending. Reiterating the aforementioned point, exploring the validity of the central government’s assumptions on the trickle-down effect of a monetary increase is paramount to understanding the state of the consumer. Our analysis suggests the assumptions are much too high. More easily observed is the basket of goods we consume everyday:
Despite the Fed’s revision yesterday, consensus expectations for growth in 2H remain comparatively optimistic in our opinion. We continue to like utilities, treasuries, and commodities on the long-side.
Ben Ryan
Analyst
