#FullGrizzly?
There's growing uncertainty over the macro outlook. Data seemingly in conflict includes labor data that appears to be solid, but housing and retail sales data that are showing signs of cooling off.
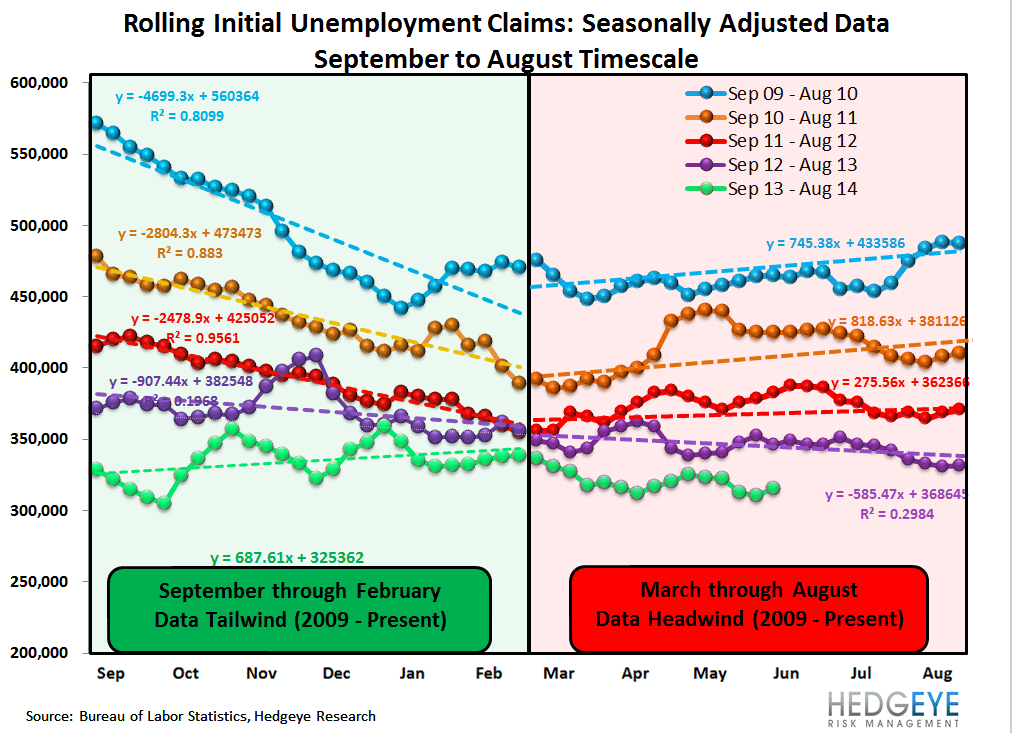
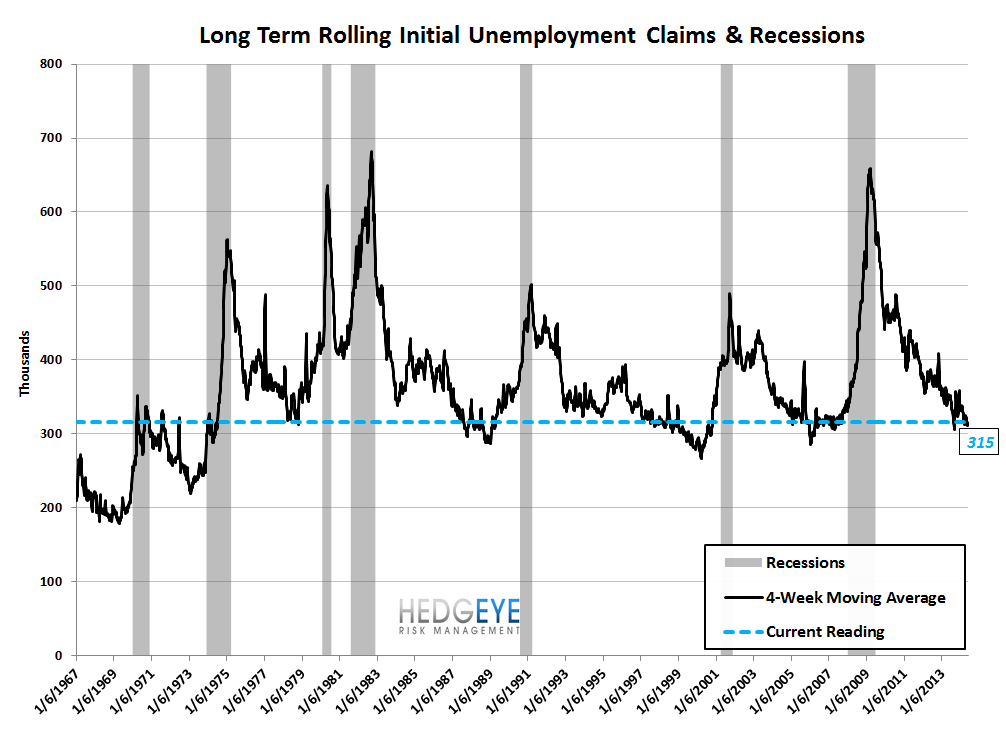
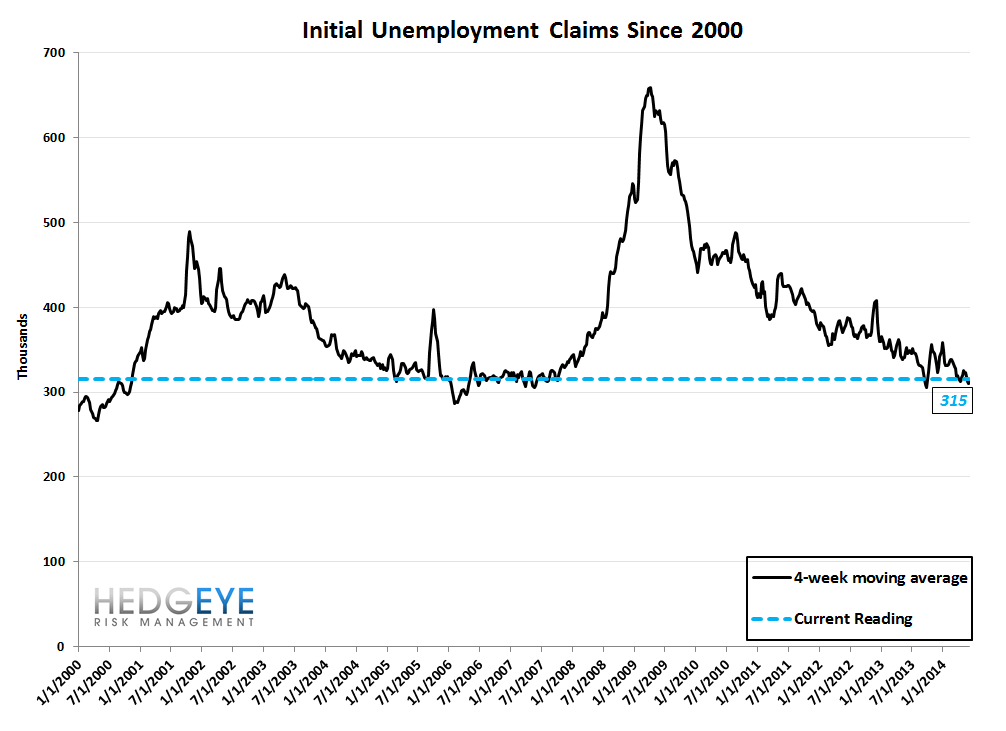
Our choice to use initial claims data as our macro weather vane stems from its accuracy in the last cycle at pinpointing both the top and bottom of the cycles on a real time basis. For example, in the last downturn initial claims began to move higher on a seasonally-adjusted basis in late 2007. Recall that the S&P 500 reached its peak level in October, 2007. Conversely, initial claims peaked and began to roll over sharply in March, 2009, also coincident with the trough in the market.
With that in mind, this morning's initial jobless claims data is good, though not great. Seasonally adjusted rolling claims are at 315k, which remains in bull market territory by historical standards. Meanwhile, the year-over-year change in rolling non-seasonally adjusted claims came in at -8.8%, also a strong print (though less strong than the week prior).
To be clear, we're getting more defensive here for a number of reasons including our expectation for home prices to decelerate, and further downward pressure on rates, and it doesn't help that the overall market valuation level looks very rich to us. That said, while we are positioning more defensively on the margin, we're not yet turning #FullGrizzly as the labor data is not showing signs of deterioration. Ultimately, that's what's needed to make the short case on the credit cycle.
The Data
Prior to revision, initial jobless claims rose 5k to 317k from 312k WoW, as the prior week's number was revised up by 1k to 313k.
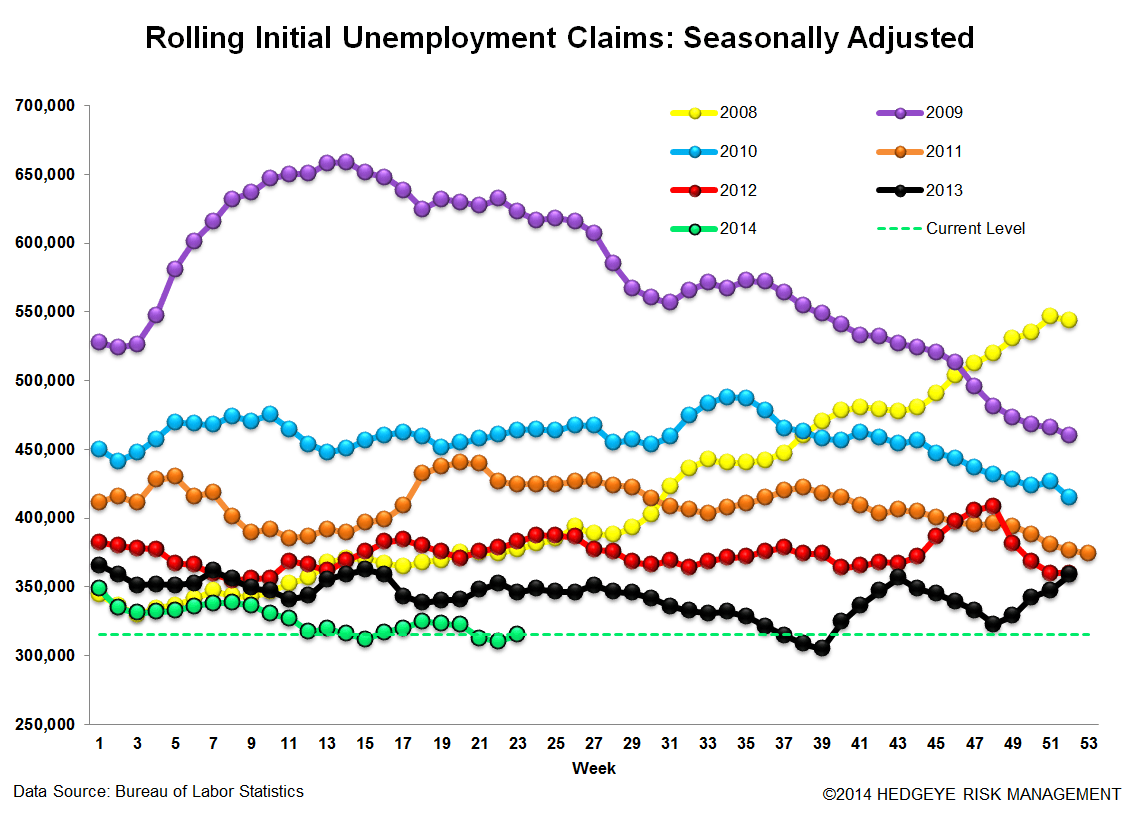
The headline (unrevised) number shows claims were higher by 4k WoW. Meanwhile, the 4-week rolling average of seasonally-adjusted claims rose 4.75k WoW to 315.25k.
The 4-week rolling average of NSA claims, which we consider a more accurate representation of the underlying labor market trend, was -8.8% lower YoY, which is a sequential deterioration versus the previous week's YoY change of -11.3%


<chart14>
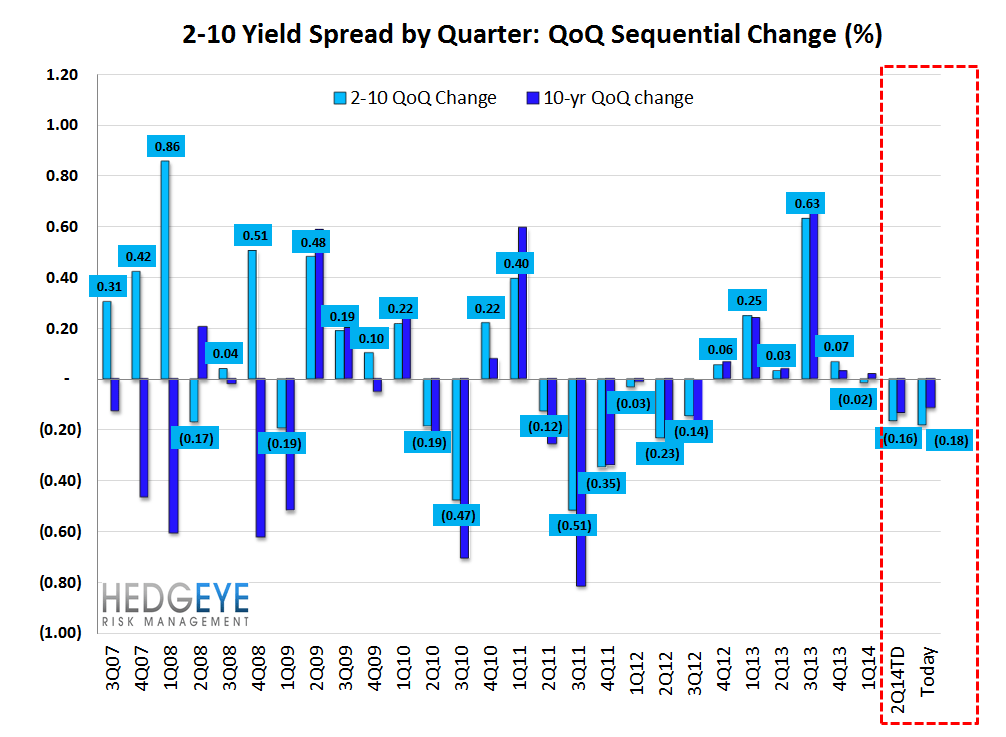
Yield Spreads
The 2-10 spread was unchanged at 221 bps week-over-week. 2Q14TD, the 2-10 spread is averaging 223 bps, which is lower by -16 bps relative to 1Q14.

Joshua Steiner, CFA
Jonathan Casteleyn, CFA, CMT