Investment Company Institute Mutual Fund Data and ETF Money Flow:
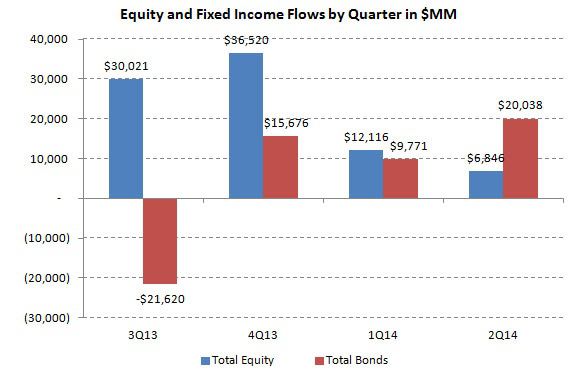
In the most recent 5 day period, fund flow in both asset classes was painfully lackluster with both fixed income and equity flow below the year-to-date averages. However the quarter-to-date trends for 2Q14 greatly favor fixed income with $20.0 billion flowing into the total bond category thus far in the quarter versus just $6.8 billion that has flowed in all equity funds. This is highlighted by 17 consecutive weeks of inflow into taxable bonds assisted by 21 consecutive weeks of inflow into tax-free fixed income funds.
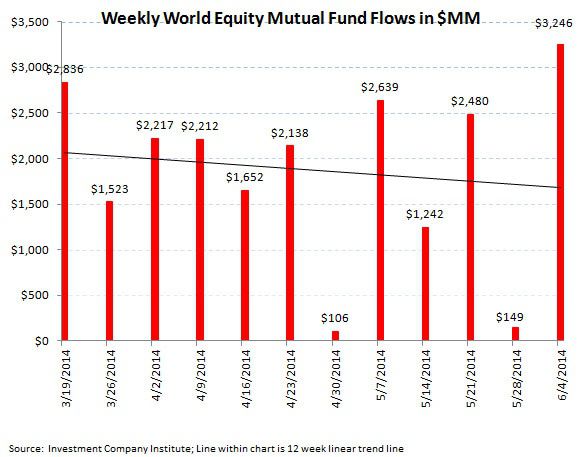
Total equity mutual funds put up a modest inflow in the most recent 5 day period ending on June 4th with $2.1 billion coming into the all stock category as reported by the Investment Company Institute. The composition of the $2.1 billion subscription continued to be weighted towards international equity funds with $3.2 billion coming into international stock funds which was offset by a $1.1 billion outflow in domestic products. This outflow within domestic equity funds has become an intermediate term trend with now the sixth consecutive week of outflow in the category. The aggregate subscription of $2.1 billion for the recent five day period was below the year-to-date average for equity funds of a $2.6 billion inflow, which is now running below the $3.0 billion weekly average inflow from 2013.
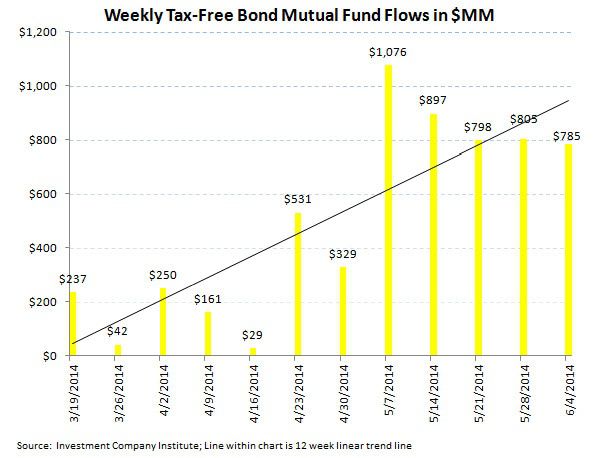
Fixed income mutual fund flows also had a lackluster week of production ending June 4th, with just $1.1 billion flowing into all fixed income funds. This interest level was a deceleration from the $2.0 billion that came into bond products the week prior, however the inflow into taxable products was the 17th consecutive week of positive flow and the inflow into municipal or tax-free products was the 21st consecutive week of positive subscriptions. The 2014 weekly average for fixed income mutual funds now stands at a $2.0 billion weekly inflow, a vast improvement from 2013's weekly average outflow of $1.5 billion, but still a far cry from the $5.8 billion weekly average inflow from 2012 (our view of the blow off top in bond fund inflow).
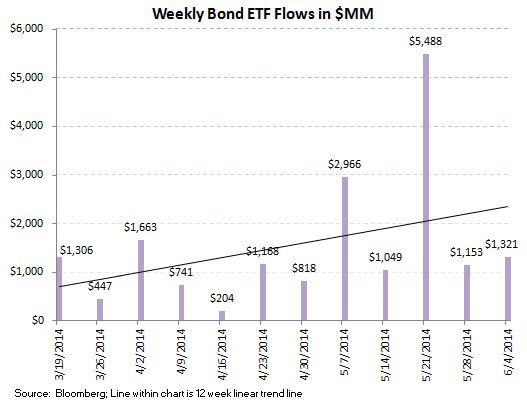
ETFs had a stronger showing than mutual funds last week with both equity and bond products experiencing inflows above the 2014 year-to-date average. Equity ETFs experienced a decent $4.5 billion inflow, while fixed income ETFs put up a $1.3 billion subscription. The 2014 weekly averages are now a $765 million weekly inflow for equity ETFs and a $1.2 billion weekly inflow for fixed income ETFs.
The net of total equity mutual fund and ETF trends against total bond mutual fund and ETF flows totaled a positive $4.1 billion spread for the week ($6.6 billion of total equity inflow versus the $2.4 billion inflow within fixed income; positive numbers imply greater money flow to stocks; negative numbers imply greater money flow to bonds). The 52 week moving average has been $7.0 billion (more positive money flow to equities), with a 52 week high of $31.0 billion (more positive money flow to equities) and a 52 week low of -$37.5 billion (negative numbers imply more positive money flow to bonds for the week).
Mutual fund flow data is collected weekly from the Investment Company Institute (ICI) and represents a survey of 95% of the investment management industry's mutual fund assets. Mutual fund data largely reflects the actions of retail investors. Exchange traded fund (ETF) information is extracted from Bloomberg and is matched to the same weekly reporting schedule as the ICI mutual fund data. According to industry leader Blackrock (BLK), U.S. ETF participation is 60% institutional investors and 40% retail investors.

Most Recent 12 Week Flow in Millions by Mutual Fund Product:


Most Recent 12 Week Flow Within Equity and Fixed Income Exchange Traded Funds:

Net Results:
The net of total equity mutual fund and ETF trends against total bond mutual fund and ETF flows totaled a positive $4.1 billion spread for the week ($6.6 billion of total equity inflow versus the $2.4 billion inflow within fixed income; positive numbers imply greater money flow to stocks; negative numbers imply greater money flow to bonds). The 52 week moving average has been $7.0 billion (more positive money flow to equities), with a 52 week high of $31.0 billion (more positive money flow to equities) and a 52 week low of -$37.5 billion (negative numbers imply more positive money flow to bonds for the week).

Quarter-to-date trends for 2Q14 greatly favor fixed income with $20.0 billion flowing into the total bond category thus far in the quarter versus just $6.8 billion that has flowed in all equity funds. This is highlighted by 17 consecutive weeks of inflow into taxable bonds assisted by 21 consecutive weeks of inflow into tax-free fixed income funds. These trends continue to support our favorite long amongst the traditional asset managers, Legg Mason (see Hedgeye LM research here).
Jonathan Casteleyn, CFA, CMT
Joshua Steiner, CFA