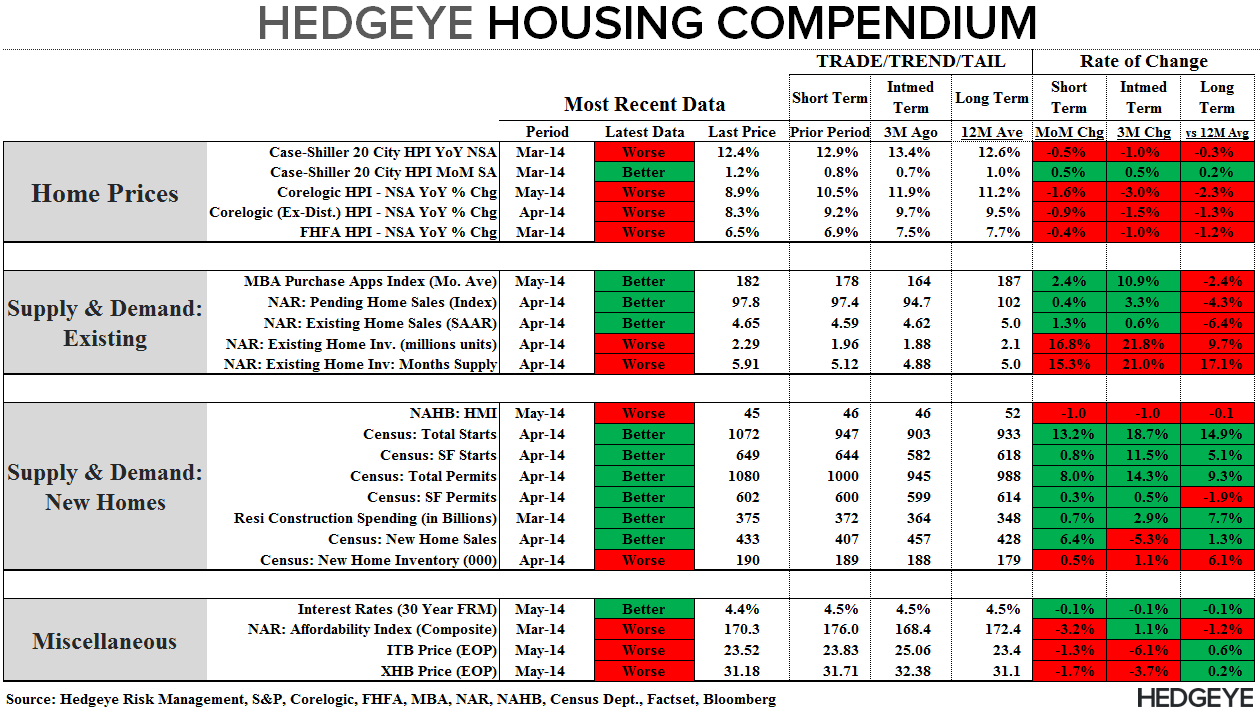
Our Hedgeye Housing Compendium table (below) aspires to present the state of the housing market in a visually-friendly format that takes about 30 seconds to consume.
Today's Focus: May CoreLogic Home Price Report
CoreLogic released its monthly home price report for April/May earlier this morning. Unlike S&P/Case-Shiller, which is a rolling 3-month average repeat sales index, CoreLogic is a single month index released on almost no lag. Essentially, it gives you information three months more current than what you get from Case-Shiller.
CoreLogic estimates that home prices rose +8.9% YoY in May, a deceleration vs the +10.5% in April and +11.1% in March. We show this in the first chart below.
Our main thesis on housing is that the rate of home price appreciation will slow meaningfully over the course of 2014 and into 2015. Historically, inflections in the rate of HPI or HPD have been major macro drivers of relative positive or negative performance.


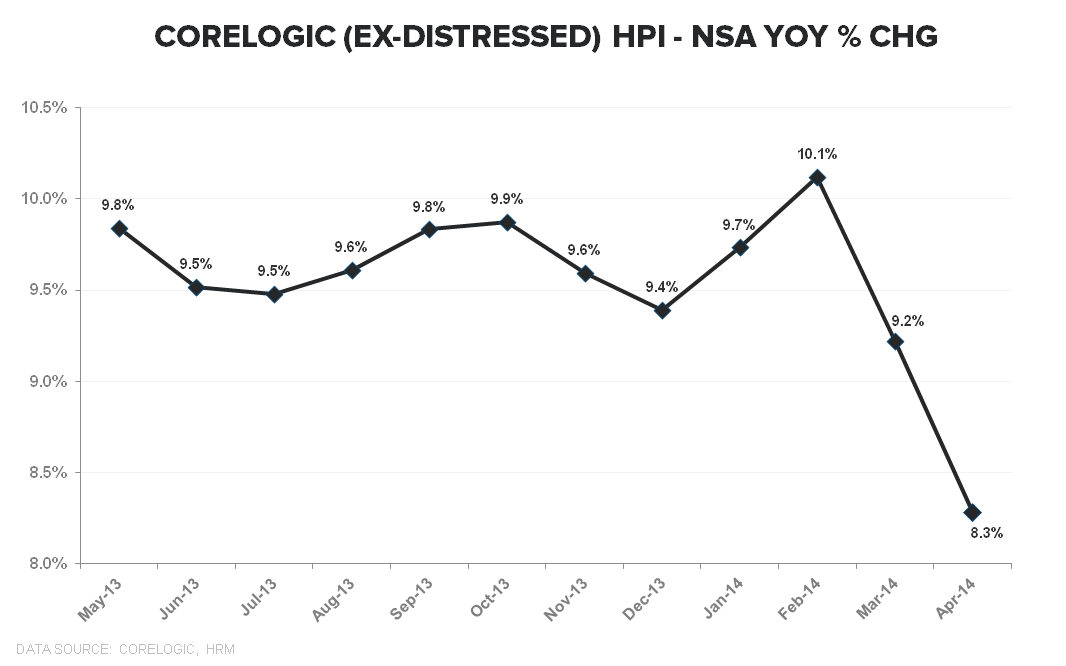
About CoreLogic:
CoreLogic HPI incorporates more than 30 years worth of repeat sales transactions, representing more than 55 million observations sourced from CoreLogic's property information database. The CoreLogic HPI provides a multi-tier market evaluation based on price, time between sales, property type, loan type (conforming vs. nonconforming), and distressed sales. The CoreLogic HPI is a repeat-sales index that tracks increases and decreases in sales prices for the same homes over time, which provides a more accurate constant-quality view of pricing trends than basing analysis on all home sales. The CoreLogic HPI covers 6,208 ZIP codes (58 percent of total U.S. population), 572 Core Based Statistical Areas (85 percent of total U.S. population) and 1,027 counties (82 percent of total U.S. population) located in all 50 states and the District of Columbia."
Joshua Steiner, CFA
Christian B. Drake
