Our Hedgeye Housing Compendium table (below) aspires to present the state of the housing market in a visually-friendly format that takes about 30 seconds to consume.

*Note - to maintain cross-metric comparability, the purchase applications index shown in the table below represents the monthly average as opposed to the most recent weekly data point.
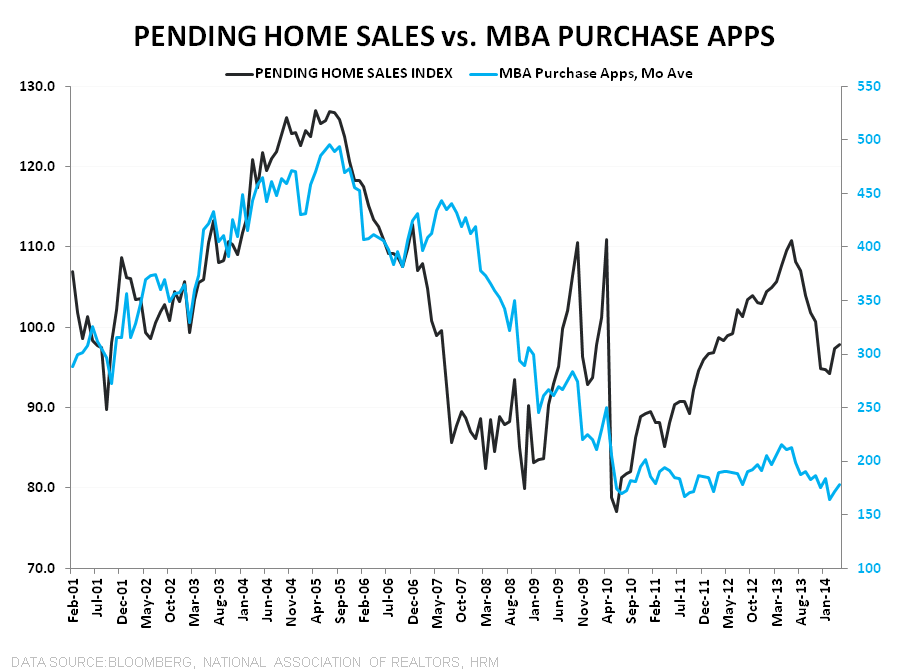
Today's Focus: April Pending Home Sales Index
The National Association of Realtors (NAR) today released its Pending Home Sales Index for the month of April. Pending Home Sales rose by 0.4% month-over-month to an index level of 97.8 (vs 97.4 in March). For reference, an index value of 100 corresponds to the average level of contract activity in the year 2001. While the report was positive month-over-month, contract activity remains down year-over-year by 9%. This is a stark contrast vs where we were one year ago, when contract activity was running +10% year-over-year. Weakness on a year-over-year basis was pervasive geographically. The best performing region is the South, where contract activity is down 6.4% y/y while the West is the worst at -15.0%.
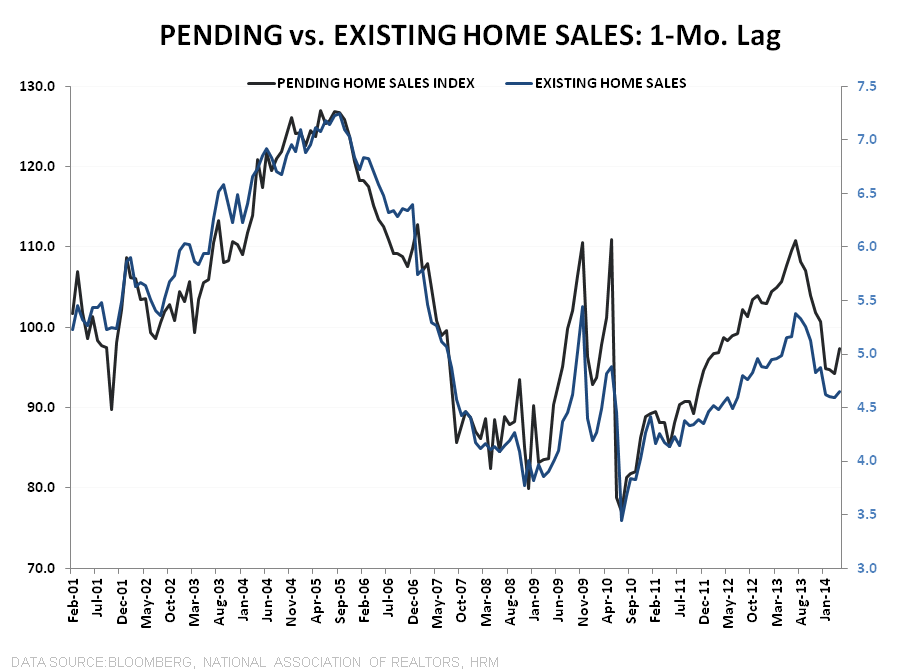
Pending Home Sales activity tends to lead price by ~18 months, as we show in the second chart below. This is why we are bearish on the outlook for HPI in 2H14 and 1H15. We expect the y/y weakness we're seeing in demand since the middle of 2013 will manifest in weaker rates of home price appreciation as we progress into 2014 and 2015. Inflections in the rate of HPI have historically been powerful macro tailwind/headwind drivers.


About Pending Home Sales:
The Pending Home Sales Index is a monthly data release from the National Association of Realtors (NAR) and is considered a leading indicator for housing activity in the US. It is a leading indicator for Existing Home Sales, not New Home Sales. A pending home sale reflects the signing of a contract, but not the closing of the transaction, which occurs 1-2 months later. The NAR uses data from the MLS and large brokers to calculate the Pending Home Sales index. An index value of 100 corresponds to the average level of activity during 2001.
Frequency:
The NAR Pending Home Sales index is released between the 25th and the 31st of each month and covers data from the prior month.
Joshua Steiner, CFA
Christian B. Drake
