Our Hedgeye Housing Compendium table (below) aspires to present the state of the housing market in a visually-friendly format that takes about 30 seconds to consume.
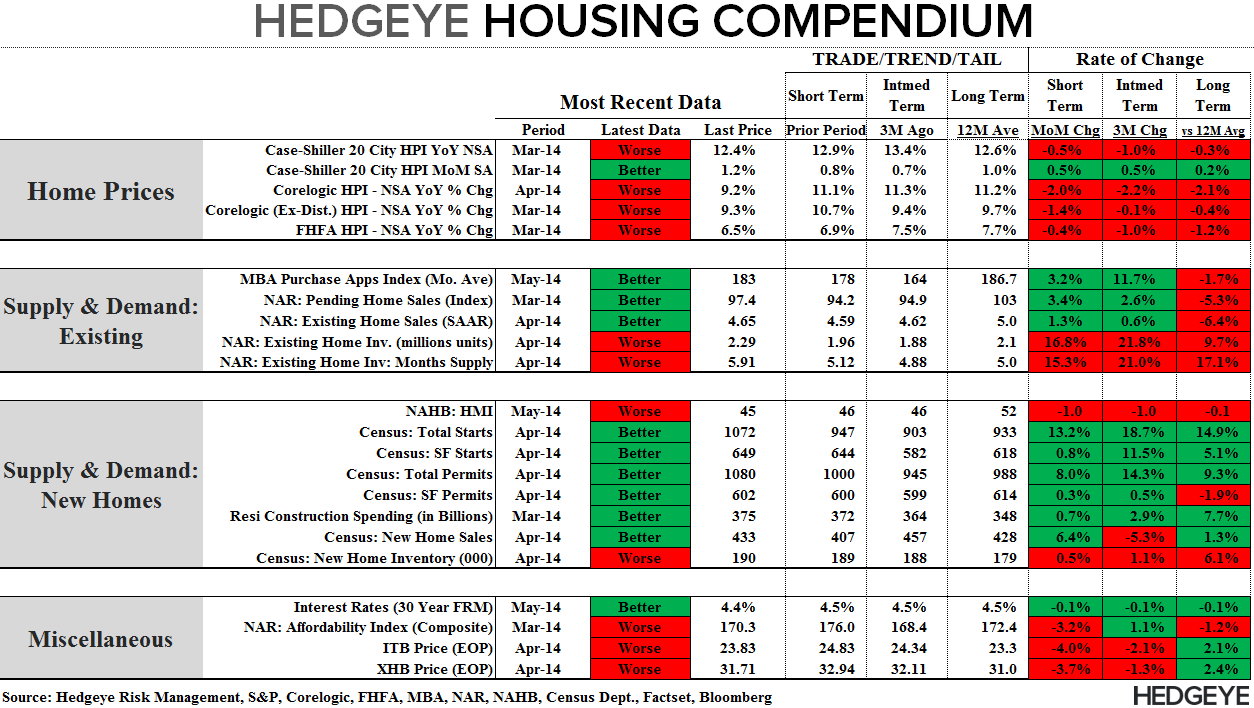
Today's Focus: March S&P/Case-Shiller Home Price Report (& FHFA)
S&P released its monthly S&P/Case-Shiller home price report for March earlier this morning. It's important to remember that S&P/Case-Shiller is a rolling 3-month average repeat sales index, meaning that you're actually seeing the Jan/Feb/Mar timeframe represented equally in this data point. So, in essence, you're looking at February data.
By contrast, we've already seen April data from Corelogic. If you were to analyze Corelogic on a rolling 3-month basis and synchronize it with Case-Shiller you'd find a near perfect correlation. What this means is that Case-Shiller is a very lagging indicator, but it remains important if only because the market still takes its cues from the Case Shiller series (despite the shortcoming).
In a nutshell, here's what Case Shiller had to say about home prices:
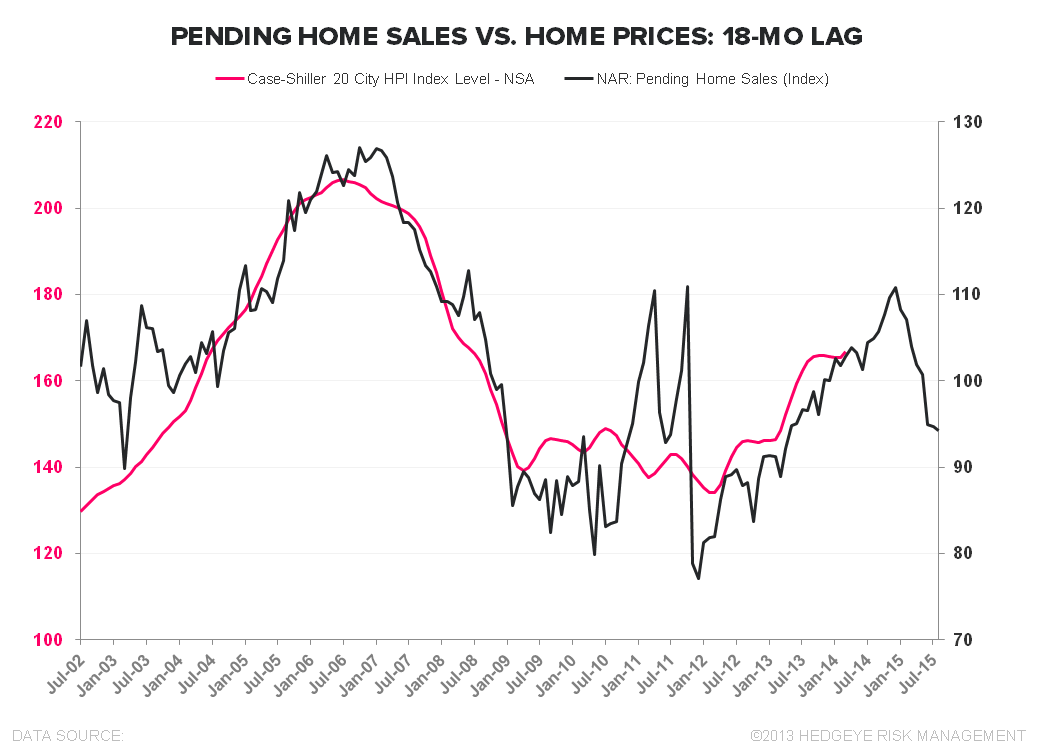
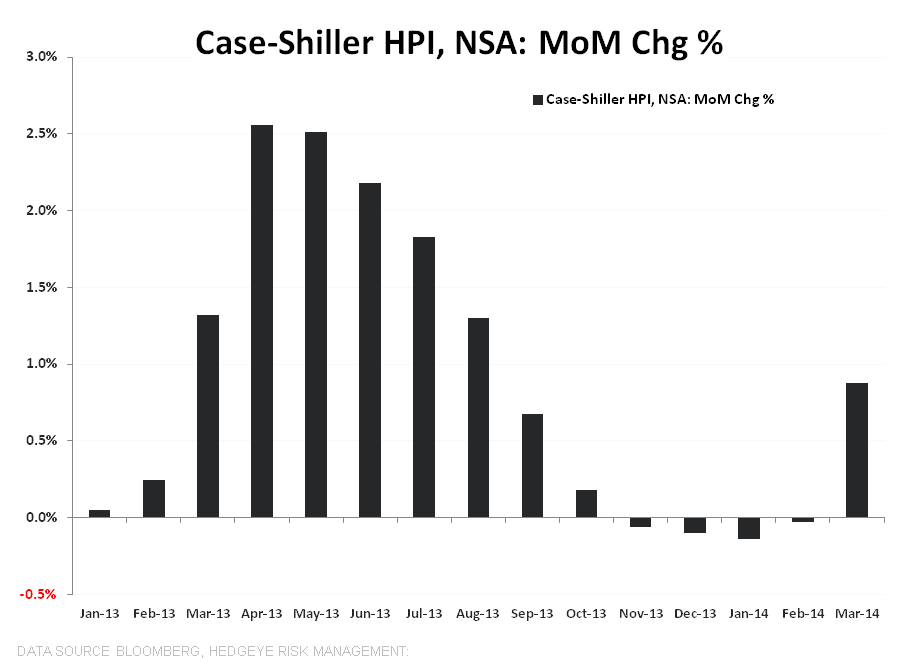
The non-seasonally adjusted Case-Shiller HPI slowed -50bps sequentially on YoY basis (+12.4% y/y in March vs +12.9% y/y in Feb) and continues to track Pending home sales nicely on an 18 month lag.
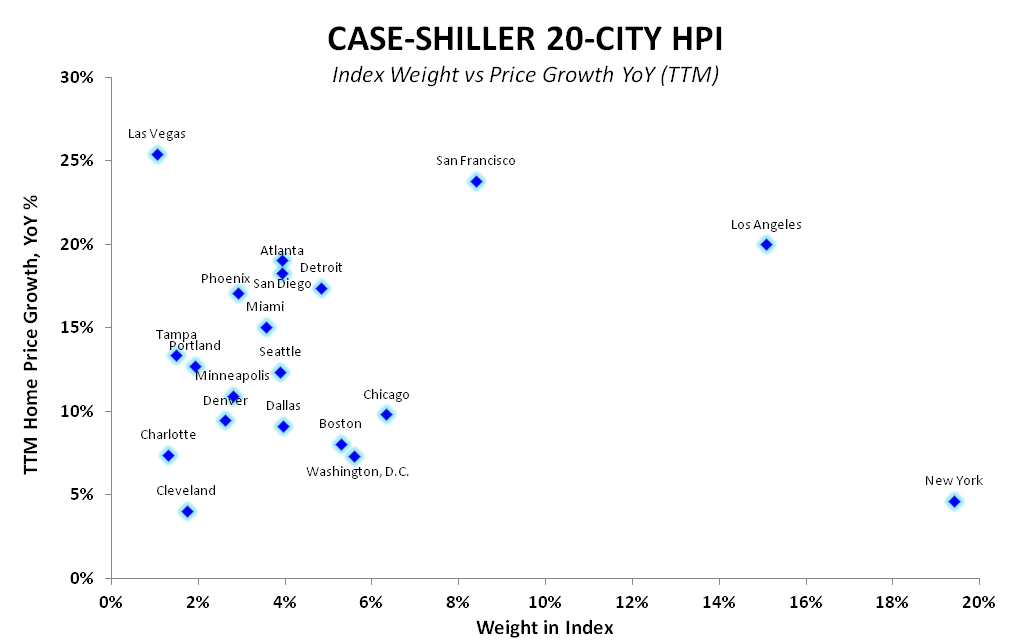
Broken down by constituent cities, the upside pull in prices from the San Fran + Los Angeles heavyweights over the past year remains apparent (2nd chart below). Of course, the drag goes both ways, and price growth is currently decelerating across LA, San Fran, and Las Vegas - and the comps get increasingly harder from here.
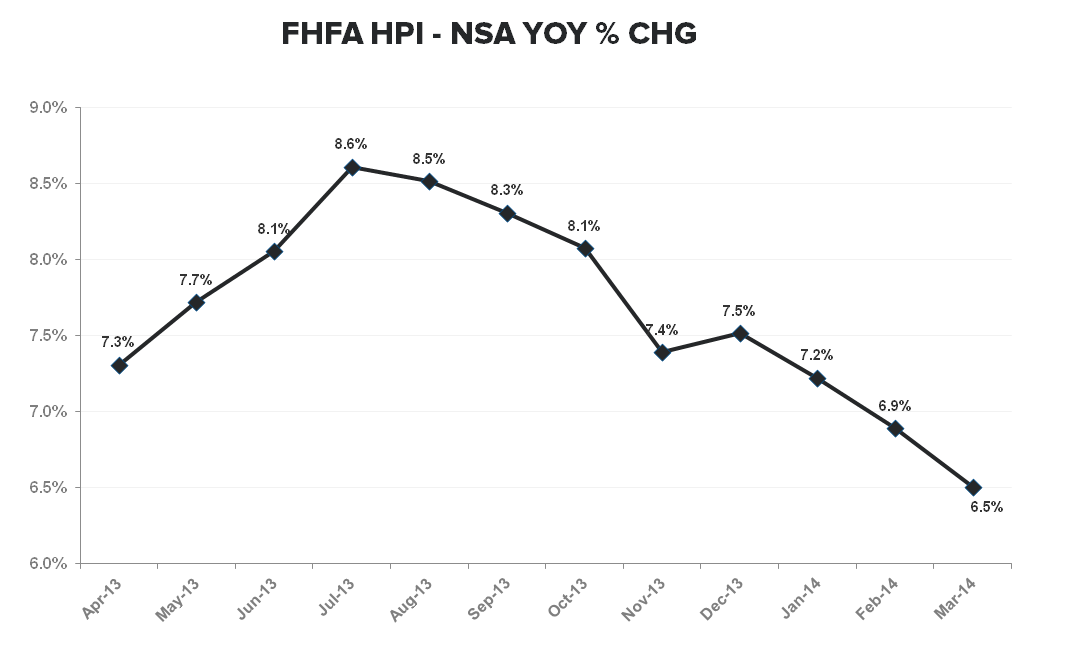
Separately, we also received the FHFA home price data this morning. FHFA is the regulator that oversees Fannie Mae and Freddie Mac and it uses Fannie/Freddie data on conforming loans to compile a more middle-of-the-road home price index. The FHFA data showed the same trend of decelerating growth on a year-over-year basis. Specifically, FHFA showed March home prices were higher by 6.5% y/y vs +6.9% y/y in February.


About Case Shiller:
The S&P/Case-Shiller Home Price Index measures the changes in value of residential real estate by tracking single-family home re-sales in 20 metropolitan areas across the US. The index uses purchase price information obtained from county assessor and recorder offices. The Case-Shiller indexes are value-weighted, meaning price trends for more expensive homes have greater influence on estimated price changes than other homes. It is vital to note that the index’s printed number is a 3-month rolling average released on a two month delay.
Frequency and Release Date:
The S&P/Case-Shiller HPI is released on the last Tuesday of every month. The index is on a two month lag and therefore does not reflect the most recent month’s home prices.
Joshua Steiner, CFA
Christian B. Drake
