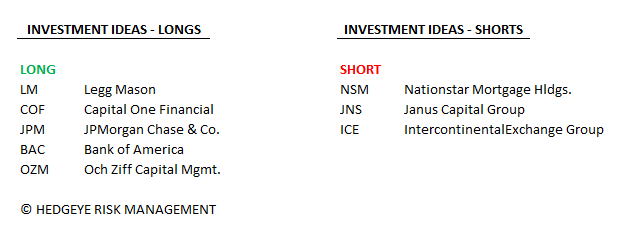
Current Best Ideas:
Key Callouts:
The pre-holiday week saw yield spreads widen modestly (+3 bps) and European interbank systemic risk measures rise further.
* 2-10 Spread – Last week the 2-10 spread widened to 219 bps, 3 bps wider than a week ago. We track the 2-10 spread as an indicator of bank margin pressure.
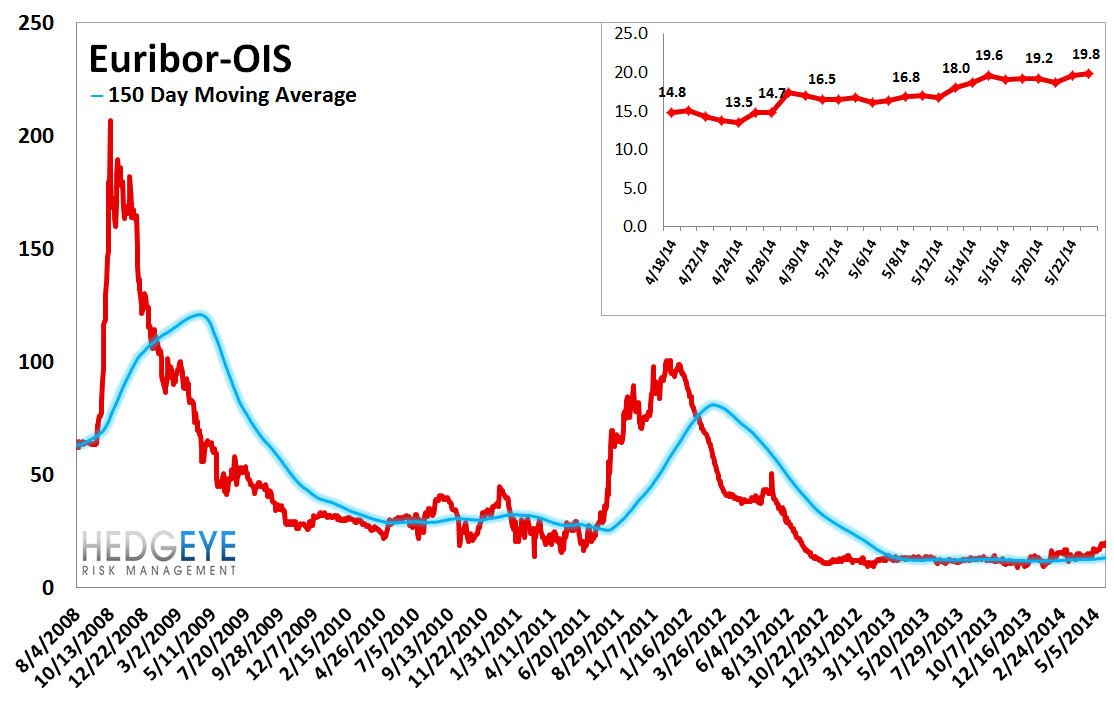
* Euribor-OIS Spread – The Euribor-OIS spread widened by 1 bps to 20 bps, continuing the directional trend that's been in place for the past month. Euribor-OIS spread (the difference between the euro interbank lending rate and overnight indexed swaps) measures bank counterparty risk in the Eurozone. The OIS is analogous to the effective Fed Funds rate in the United States. Banks lending at the OIS do not swap principal, so counterparty risk in the OIS is minimal. By contrast, the Euribor rate is the rate offered for unsecured interbank lending. Thus, the spread between the two isolates counterparty risk.
Financial Risk Monitor Summary
• Short-term(WoW): Negative / 1 of 12 improved / 5 out of 12 worsened / 6 of 12 unchanged
• Intermediate-term(WoW): Positive / 5 of 12 improved / 4 out of 12 worsened / 3 of 12 unchanged
• Long-term(WoW): Positive / 3 of 12 improved / 2 out of 12 worsened / 7 of 12 unchanged

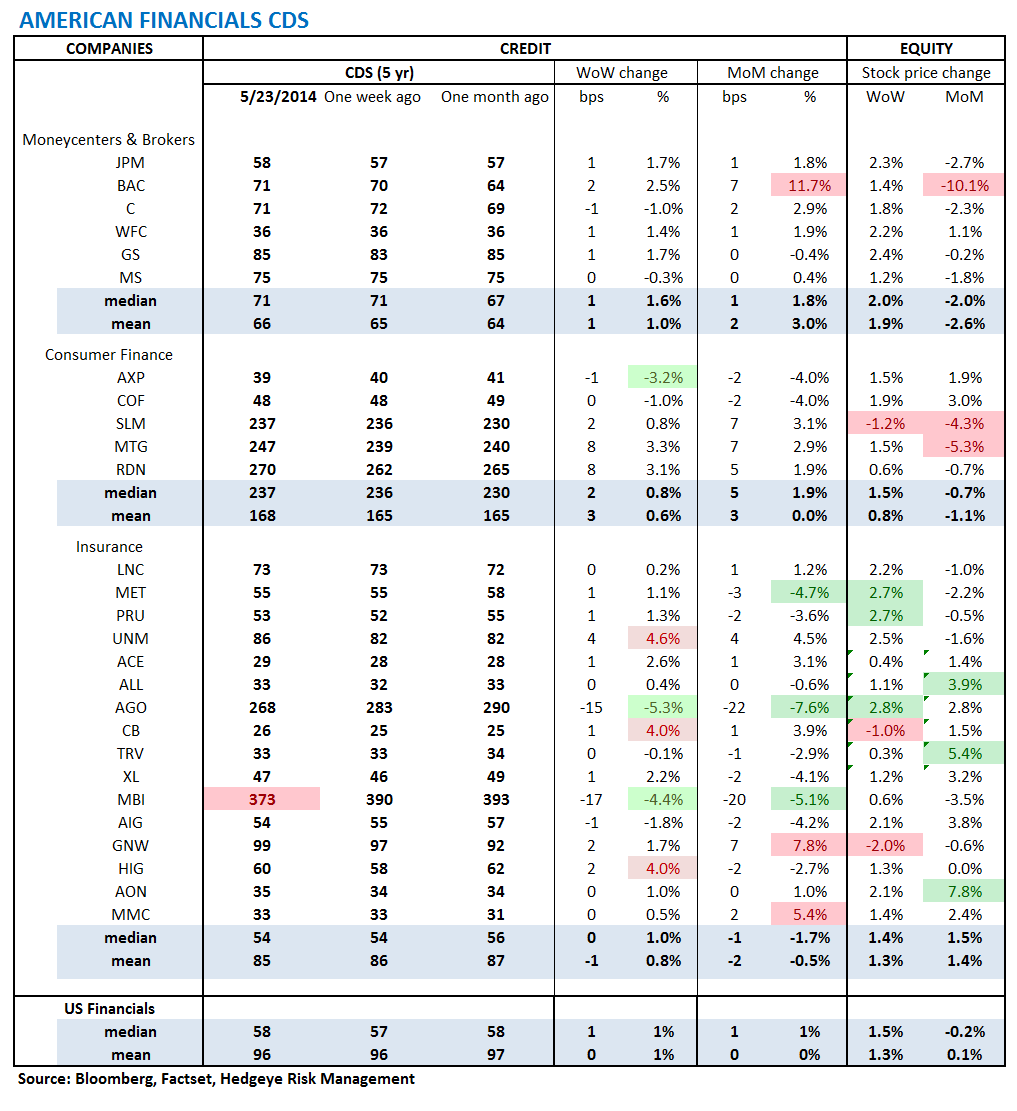
1. U.S. Financial CDS - Swaps were fairly uneventful for the most part last week across the US Financials. That said, there were notable moves (wider) in the mortgage insurers and (tighter) in the bond guarantors.
Tightened the most WoW: AGO, MBI, AXP
Widened the most WoW: UNM, HIG, CB
Tightened the most WoW: AGO, MBI, MET
Widened the most MoM: BAC, GNW, MMC
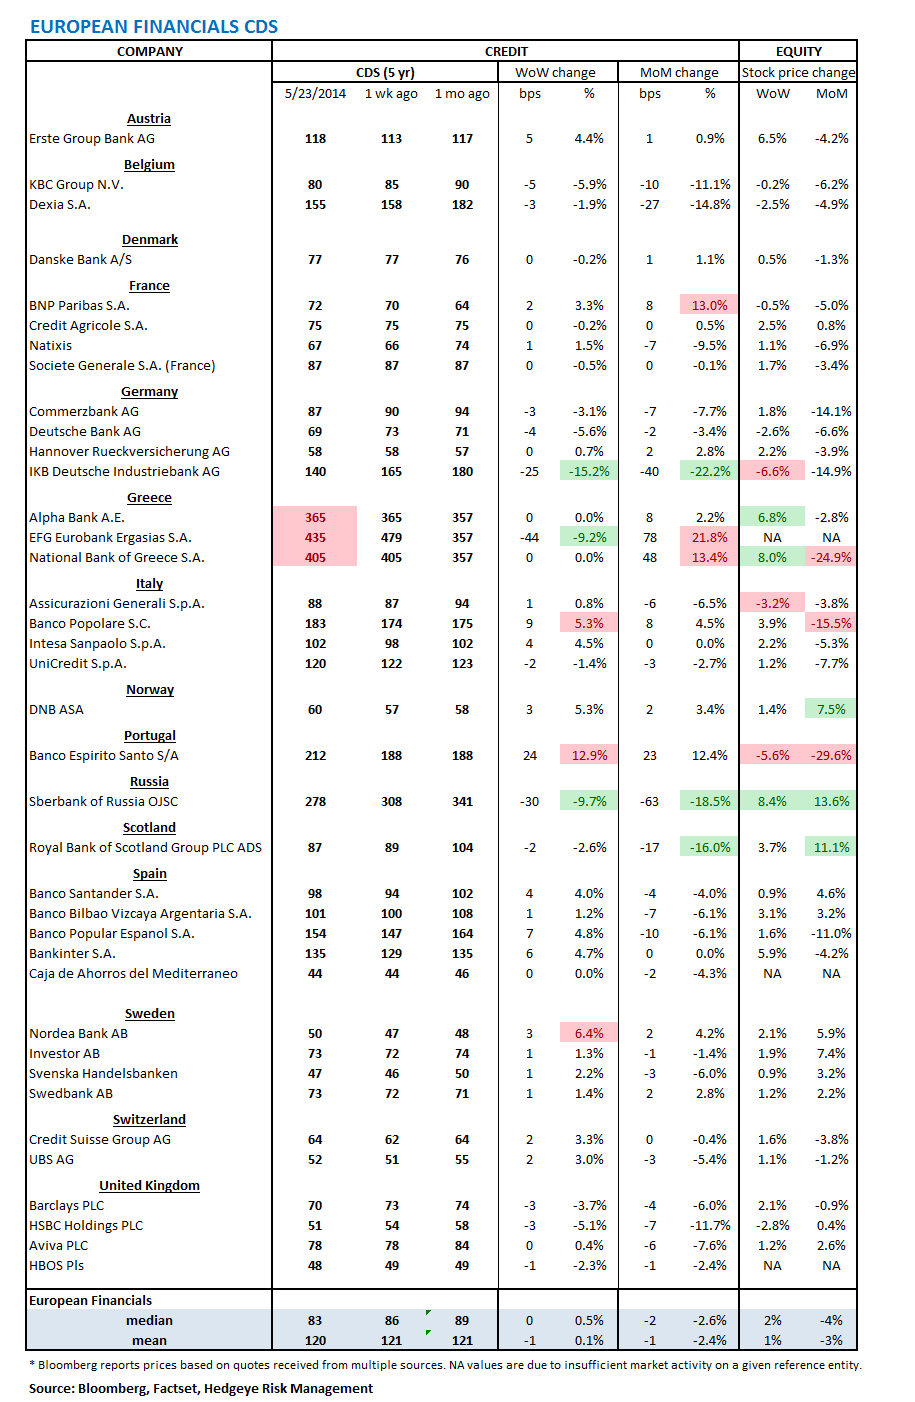
2. European Financial CDS - Swaps were little changed in Europe last week, though a big move came at Russia's Sberbank where spreads tightened by 30 bps w/w and are now tighter by 63 bps m/m.
3. Asian Financial CDS - Indian banks put on another impressive display of tightening, compressing by an average 21 bps w/w and are now tighter by 66 bps, on average, m/m. Japanese and Chinese banks were narrowly wider on the week.

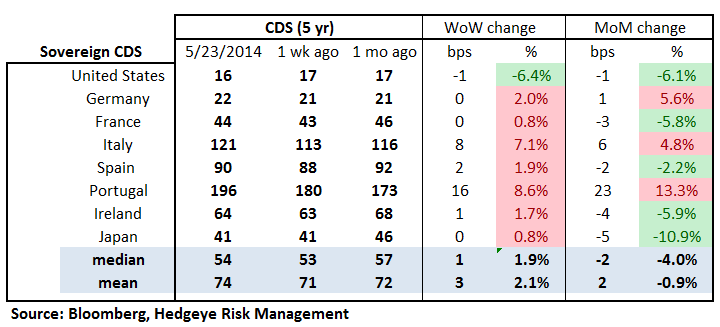
4. Sovereign CDS – Sovereign swaps were wider across the board last week except for in the US, where they tightened 1 basis point. Portugal and Italy led the charge higher, rising by 16 and 8 bps, respectively.


5. High Yield (YTM) Monitor – High Yield rates rose 1.3 bps last week, ending the week at 5.53% versus 5.51% the prior week.

6. Leveraged Loan Index Monitor – The Leveraged Loan Index rose 1.0 points last week, ending at 1870.

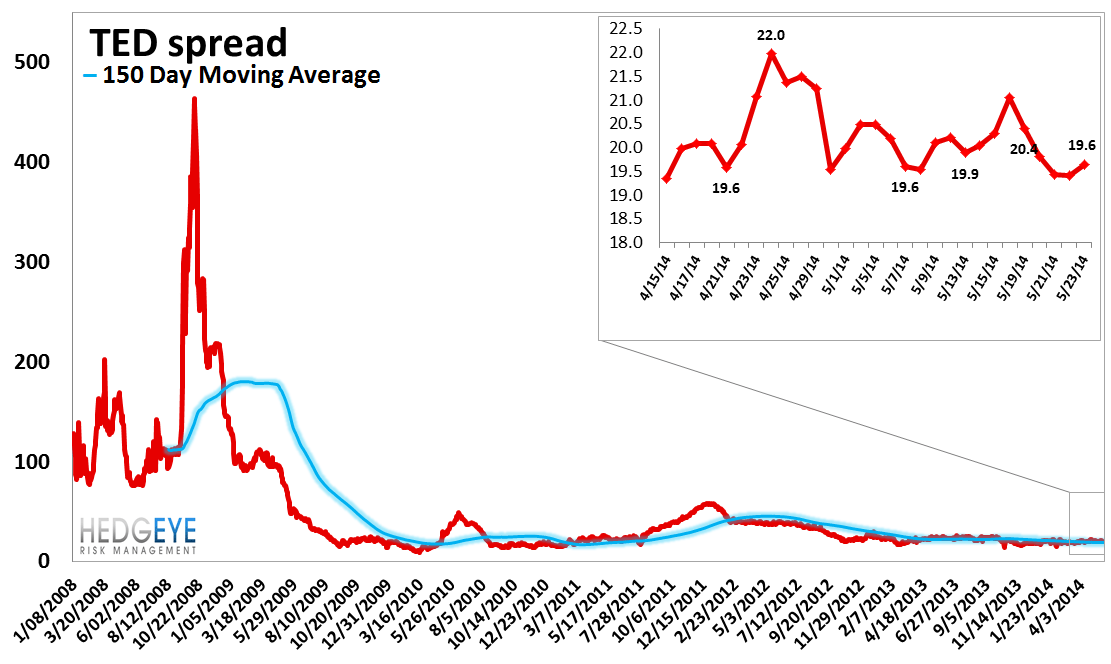
7. TED Spread Monitor – The TED spread fell 1.5 basis points last week, ending the week at 19.6 bps this week versus last week’s print of 21.06 bps.
8. CRB Commodity Price Index – The CRB index rose 0.1%, ending the week unchanged at 308 vs the prior week. As compared with the prior month, commodity prices have decreased -1.3% We generally regard changes in commodity prices on the margin as having meaningful consumption implications.

9. Euribor-OIS Spread – The Euribor-OIS spread (the difference between the euro interbank lending rate and overnight indexed swaps) measures bank counterparty risk in the Eurozone. The OIS is analogous to the effective Fed Funds rate in the United States. Banks lending at the OIS do not swap principal, so counterparty risk in the OIS is minimal. By contrast, the Euribor rate is the rate offered for unsecured interbank lending. Thus, the spread between the two isolates counterparty risk. The Euribor-OIS spread widened by 1 bps to 20 bps.
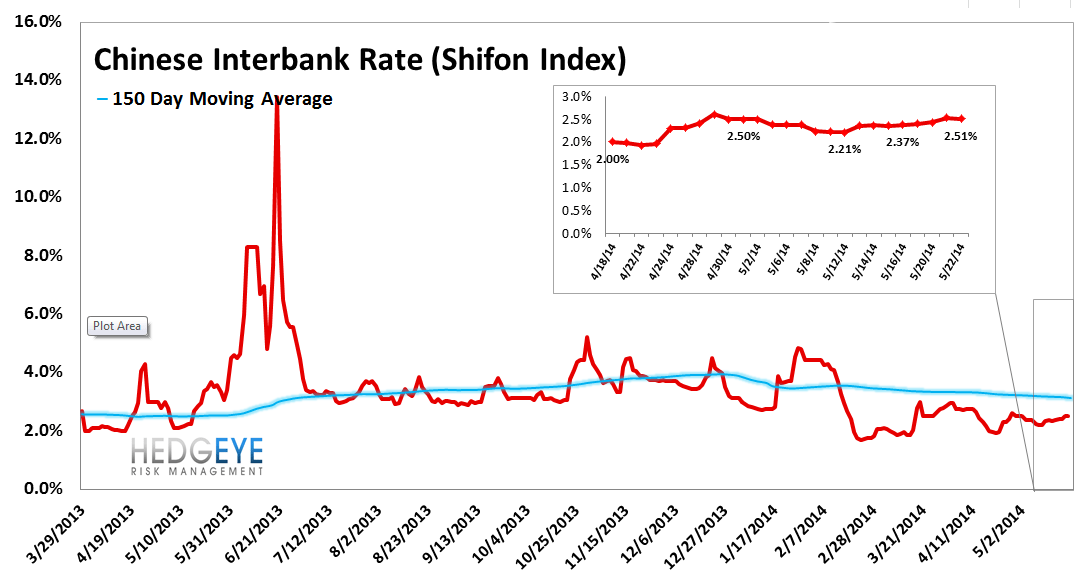
10. Chinese Interbank Rate (Shifon Index) – The Shifon Index rose 14 basis points last week, ending the week at 2.51% versus last week’s print of 2.37%. The Shifon Index measures banks’ overnight lending rates to one another, a gauge of systemic stress in the Chinese banking system.
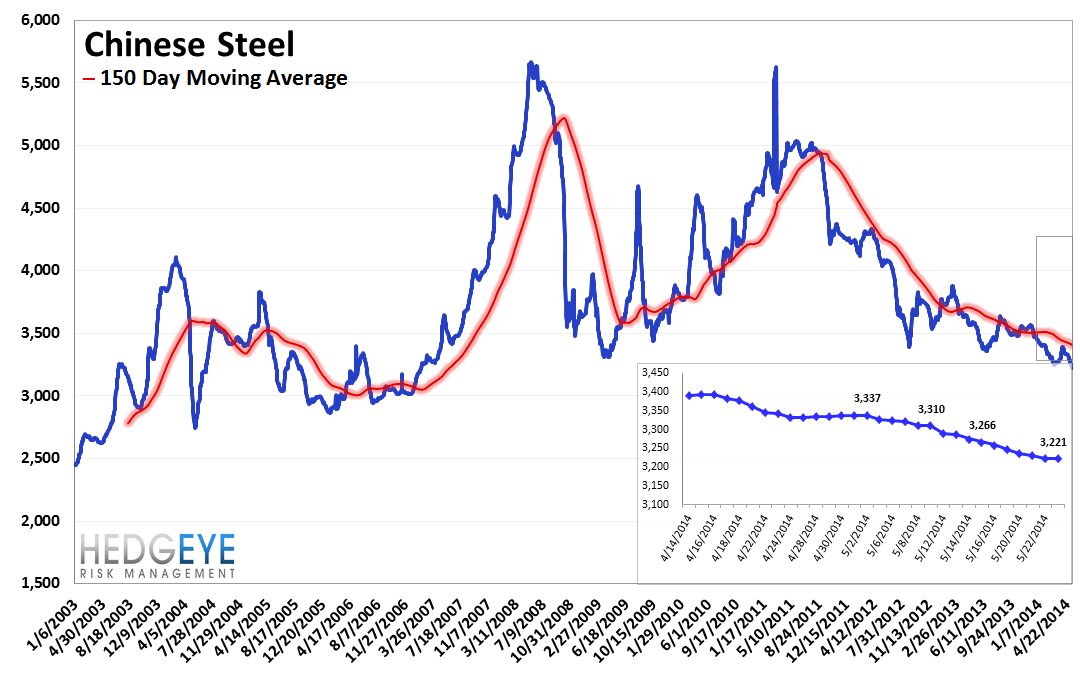
11. Chinese Steel – Steel prices in China fell 1.1% last week, or 37 yuan/ton, to 3,221 yuan/ton. We use Chinese steel rebar prices to gauge Chinese construction activity, and, by extension, the health of the Chinese economy.
12. 2-10 Spread – Last week the 2-10 spread widened to 219 bps, 3 bps wider than a week ago. We track the 2-10 spread as an indicator of bank margin pressure.

13. XLF Macro Quantitative Setup – Our Macro team’s quantitative setup in the XLF shows 1.0% upside to TRADE resistance and 0.6% downside to TRADE support.

Joshua Steiner, CFA
Jonathan Casteleyn, CFA, CMT
