Editor's Note: This research note was originally sent to subscribers on May 22, 2014 by Hedgeye’s Financials analyst Jonathan Casteleyn. Follow Jonathan on Twitter @HedgeyeJC.

ICI Mutual Fund Data and ETF Money Flow
In the most recent 5 day period, the combination of taxable and tax-free bond funds had another strong week of production with $3.9 billion in inflow, well above the running year-to-date average of $2.1 billion. Conversely, equity funds had only the third net outflow of the year with $1.0 billion leaving all equity mutual funds, well below the year-to-date average of a $3.1 billion inflow.
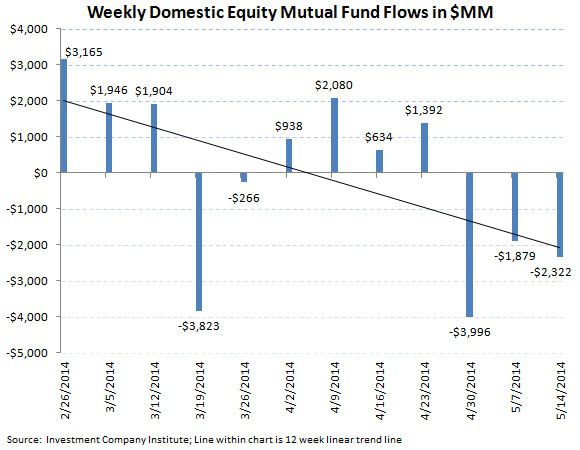
Total equity mutual fund flows experienced only the third net outflow of 2014 with $1.0 billion being redeemed through a combination of domestic and international equity funds as reported by the Investment Company Institute (ICI). The culprit was the substantial $2.3 billion that came out of domestic stock funds which was slightly offset by the $1.2 billion inflow into international products for the week ending May 14th. Both equity categories were below the running 2014 weekly averages with the combined weekly mean for all equity products remaining a $3.1 billion inflow, now basically on par with the $3.1 billion weekly average inflow from 2013.
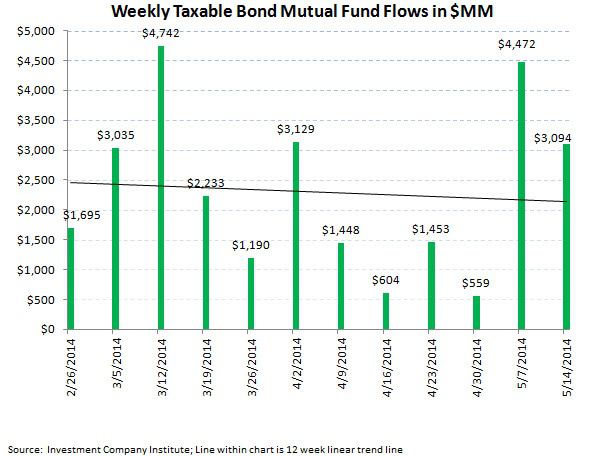
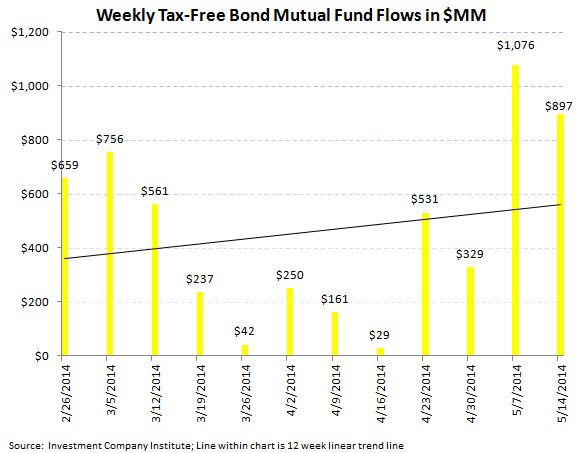
Conversely, fixed income mutual fund flows continued on much strong footing for the week ending May 14th, with another solid $3.9 billion flowing into all fixed income funds. While this production was a slight deceleration from the $5.4 billion that came into bond products last week, the inflow into taxable products was the 14th consecutive week of positive flow and the inflow into municipal or tax-free products was the 18th consecutive week of positive subscriptions. The 2014 weekly average for fixed income mutual funds now stands at a $2.1 billion weekly inflow, a vast improvement from 2013's weekly average outflow of $1.5 billion, but still a far cry from the $5.8 billion weekly average inflow from 2012 (our view of the blow off top in bond fund inflow).
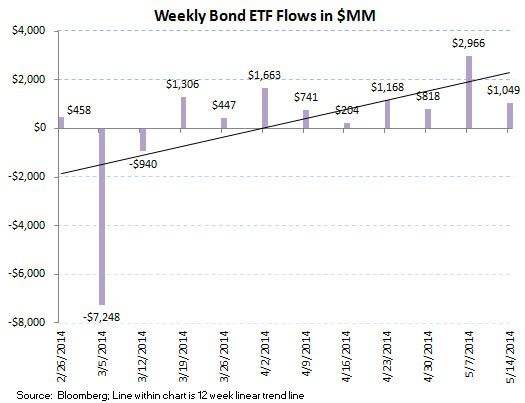
Exchange traded funds (ETFs) had positive trends on both sides of the ledger this week with a solid equity inflow complemented by a moderate inflow into bond exchange traded funds. Equity ETFs experienced a robust $9.6 billion inflow, while fixed income ETFs put up a $1.0 billion subscription. The 2014 weekly averages are now a $870 million weekly inflow for equity ETFs and a $1.0 billion weekly inflow for fixed income ETFs.
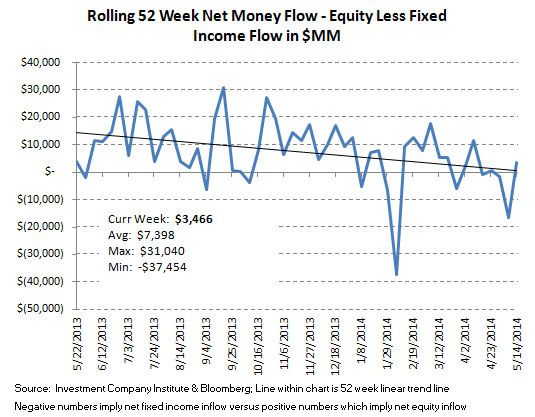
The net of total equity mutual fund and ETF trends against total bond mutual fund and ETF flows totaled a positive $3.4 billion spread for the week ($8.5 billion of total equity inflow versus the $5.1 billion inflow within fixed income; positive numbers imply greater money flow to stocks; negative numbers imply greater money flow to bonds). The 52 week moving average has been $7.3 billion (more positive money flow to equities), with a 52 week high of $31.0 billion (more positive money flow to equities) and a 52 week low of -$37.5 billion (negative numbers imply more positive money flow to bonds for the week).
Mutual fund flow data is collected weekly from the ICI and represents a survey of 95% of the investment management industry's mutual fund assets. Mutual fund data largely reflects the actions of retail investors. ETF information is extracted from Bloomberg and is matched to the same weekly reporting schedule as the ICI mutual fund data. According to industry leader Blackrock (BLK), U.S. ETF participation is 60% institutional investors and 40% retail investors.


Most Recent 12 Week Flow in Millions by Mutual Fund Product


Most Recent 12 Week Flow Within Equity and Fixed Income Exchange Traded Funds

Net Results
The net of total equity mutual fund and ETF trends against total bond mutual fund and ETF flows totaled a positive $3.4 billion spread for the week ($8.5 billion of total equity inflow versus the $5.1 billion inflow within fixed income; positive numbers imply greater money flow to stocks; negative numbers imply greater money flow to bonds). The 52 week moving average has been $7.3 billion (more positive money flow to equities), with a 52 week high of $31.0 billion (more positive money flow to equities) and a 52 week low of -$37.5 billion (negative numbers imply more positive money flow to bonds for the week).