The table below lists our current investment ideas as well as a list of potential ideas we are in the process of evaluating (watch list). We intend to update this table regularly and will provide detail on any material changes.

Consumer Staples was flat week over week versus the broader market (SPX) up 1.2%. XLP is up 3.0% year-to-date versus the SPX at 2.8%.
Events This Week (in EST):
Earnings Calls
Wednesday (5/29): SAFM 11am
Wednesday (5/29): BNNY 5pm
Citi Global Consumer Conference
Tuesday (5/28): BUD (9:05am); BG (9:05am); THS (11:20am); JAH (11:20am); DEO (2:25pm); SAB (3:55pm)
Wednesday (5/29): MDLZ (8am); NUS (1pm); HAIN (2:30pm)
Sanford Bernstein Strategic Decisions Conference
Wednesday (5/29): CL (8am); KMB (10am)
Thursday (5/30): MKC (8am); EL (11am)
For over two months, XLP is bullish on immediate term TRADE and intermediate term TREND durations from a quantitative set-up.

The Hedgeye U.S. Consumption Model has shown steady improvement over the past three weeks, with 5 of the 12 metrics flashing green for the second week in a row.

Despite the bullish quantitative set-up for the sector, we continue to believe that the group is facing numerous headwinds, including:
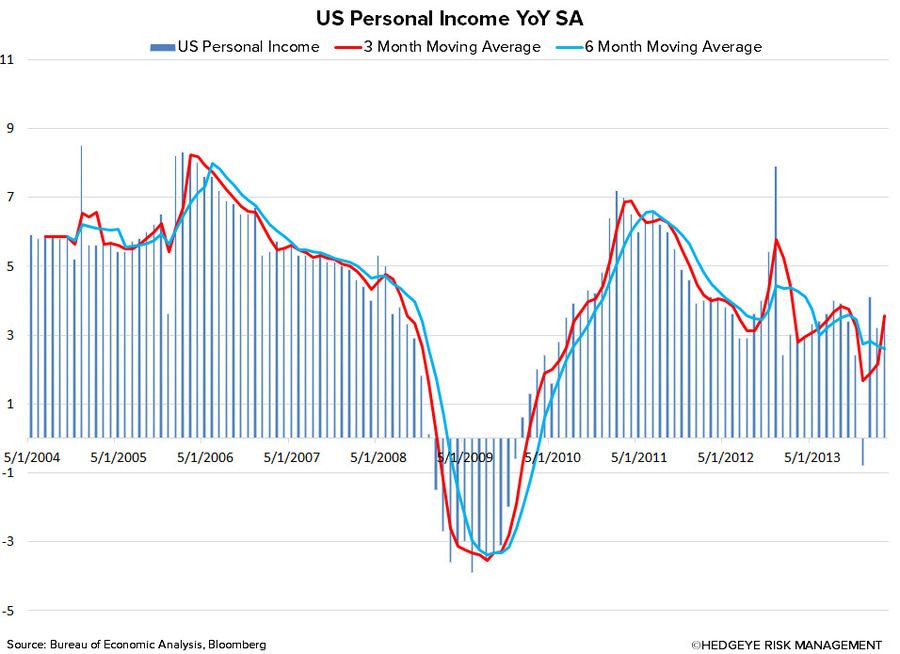
- U.S. consumption growth is slowing as inflation rises, in-line with the Macro team’s 1Q14 theme of #InflationAccelerating, and Q2 2014 theme of #ConsumerSlowing
- The economies and currencies of the emerging market – once the sector’s greatest growth engine – remain weak with the prospect of higher inflation in 2014 eroding real growth
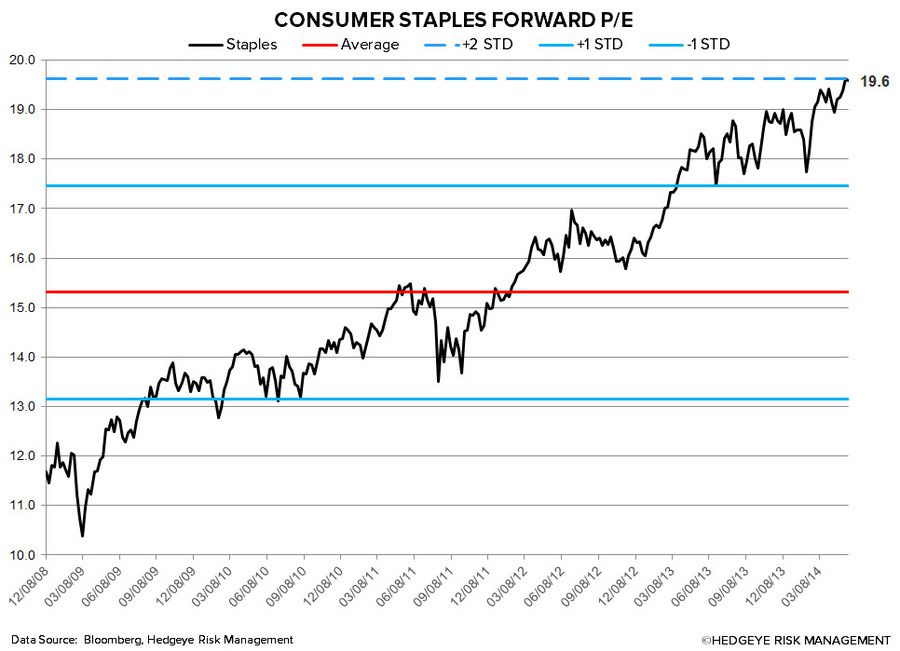
- The sector is loaded with a premium valuation (P/E of 19.6x)
- Less sector Yield Chasing as Fed continues its tapering program
- The high frequency Bloomberg weekly U.S. Consumer Comfort Index (recently rescaled for cosmetic and not component reasons) has not seen any real improvement over the past 6 months, and fell to 34.1 versus 34.9 in the prior week

Top 5 Week-over-Week Divergent Performances:
Positive Divergence: DF 7.7%; POST 5.0%; LO 4.5%; REV 3.9%; HLF 3.6%
Negative Divergence: SODA -7.6%; HRL -4.7%; TSN -2.9%; CPB -2.3%; FLO -2.1%
Last Week’s Research Notes
Quantitative Setup
In the charts below we look at the largest companies by market cap in the Consumer Staples space from both a quantitative perspective and fundamental aspect where we can offer one. As you will see over time, sometimes our fundamental view does not align with the quantitative setup (though not often).
BUD – bullish on almost every style factor that is working (big cap, slow-growth, etc.); TREND support = $105.87

DEO – recent bearish to bullish intermediate-term TREND reversal confirmed last week; TREND support = $125.28

KO – bullish on almost every style factor that is working; intermediate-term TREND support = $39.83

PEP – correction last week didn’t change the bullish intermediate-term TREND here – support = $83.87

GIS – still one of the best looking big cap slow-growth consumer names on my screens – TREND support = $51.72

MDLZ – correction last week came on no volume; bullish intermediate-term TREND intact at $35.45

KMB – stock has traded sideways for 3 months but remains a bullish intermediate-term TREND signal @Hedgeye with $108.09

PG – correction here looks more concerning than MDLZ or PEP as the TREND line is nearby at $80.13

MO – bullish TREND that holds most of the slow-growth-yield-chasing style factors the market is rewarding; TREND support = $38.61

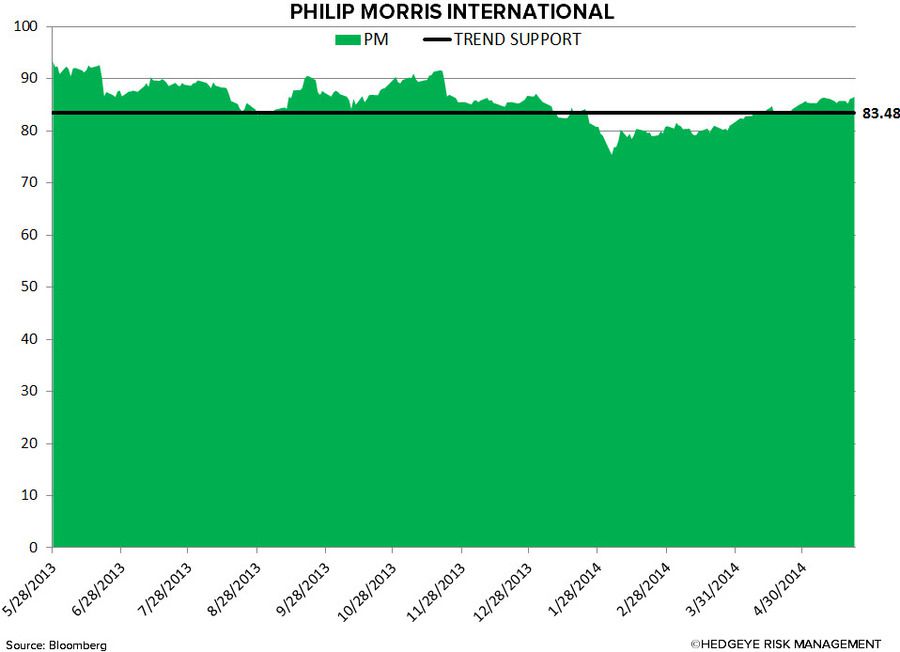
PM – bearish to bullish TREND reversal confirmed again last week; intermediate-term TREND support = $83.48
Howard Penney
Managing Director
Matt Hedrick
Associate
Fred Masotta
Analyst
