Our Hedgeye Housing Compendium table (below) aspires to present the state of the housing market in a visually-friendly format that takes about 30 seconds to consume.

Today's Focus: April New Home Sales Report
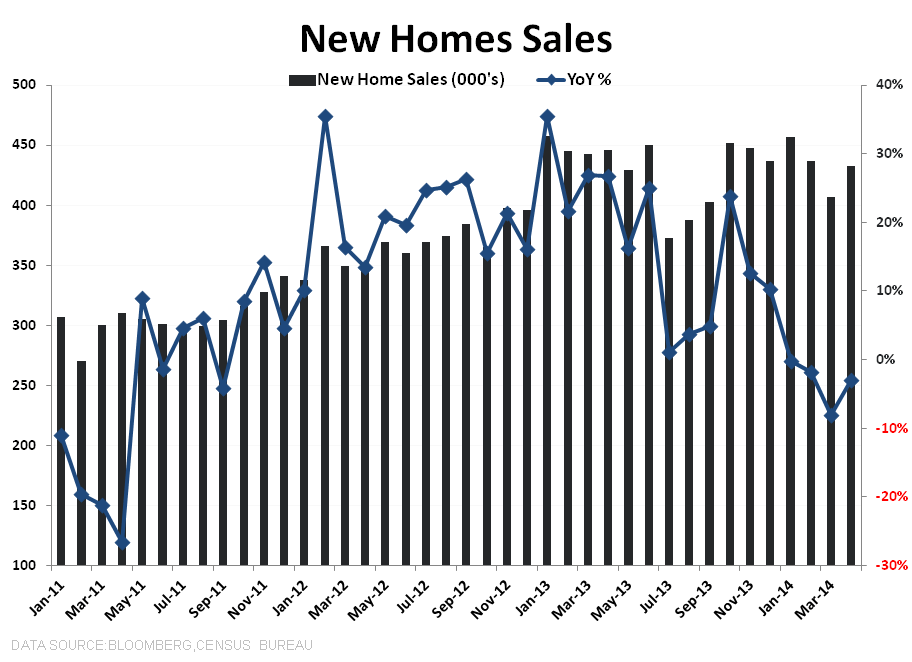
The Census Bureau released its monthly New Home Sales report for April earlier this morning. Not surprisingly, following last month's extreme weakness (March was down 14.5% month-over-month before a subsequent upward revision) this month's number was up, rising 6.4% month-over-month.
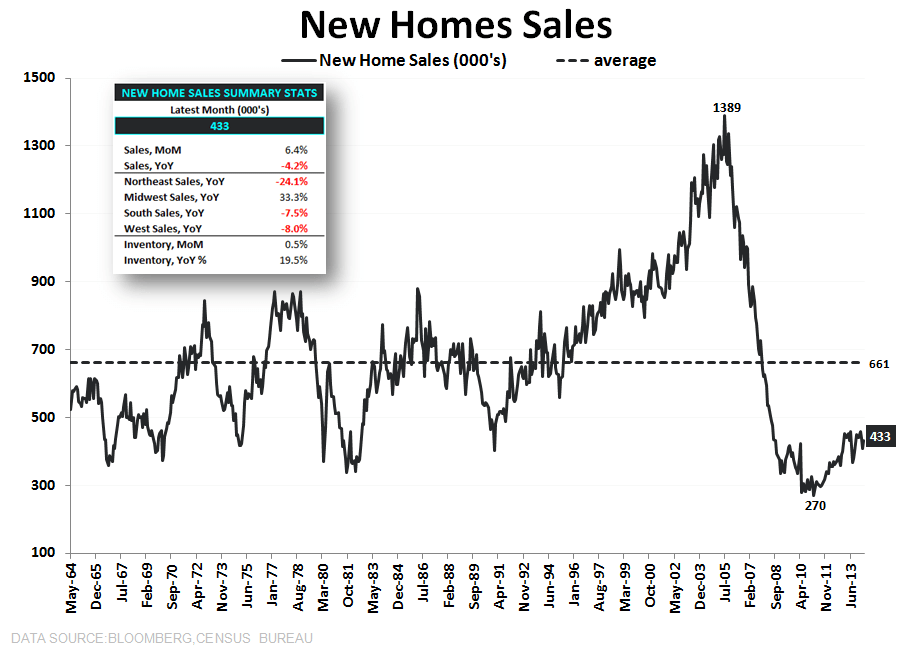
The big takeaway is that New Home Sales are running sideways to down since January, 2013. We show this in the chart below. Remember that New Home Sales are different than Housing Starts in that the number excludes condos, apartments and owner-built homes.
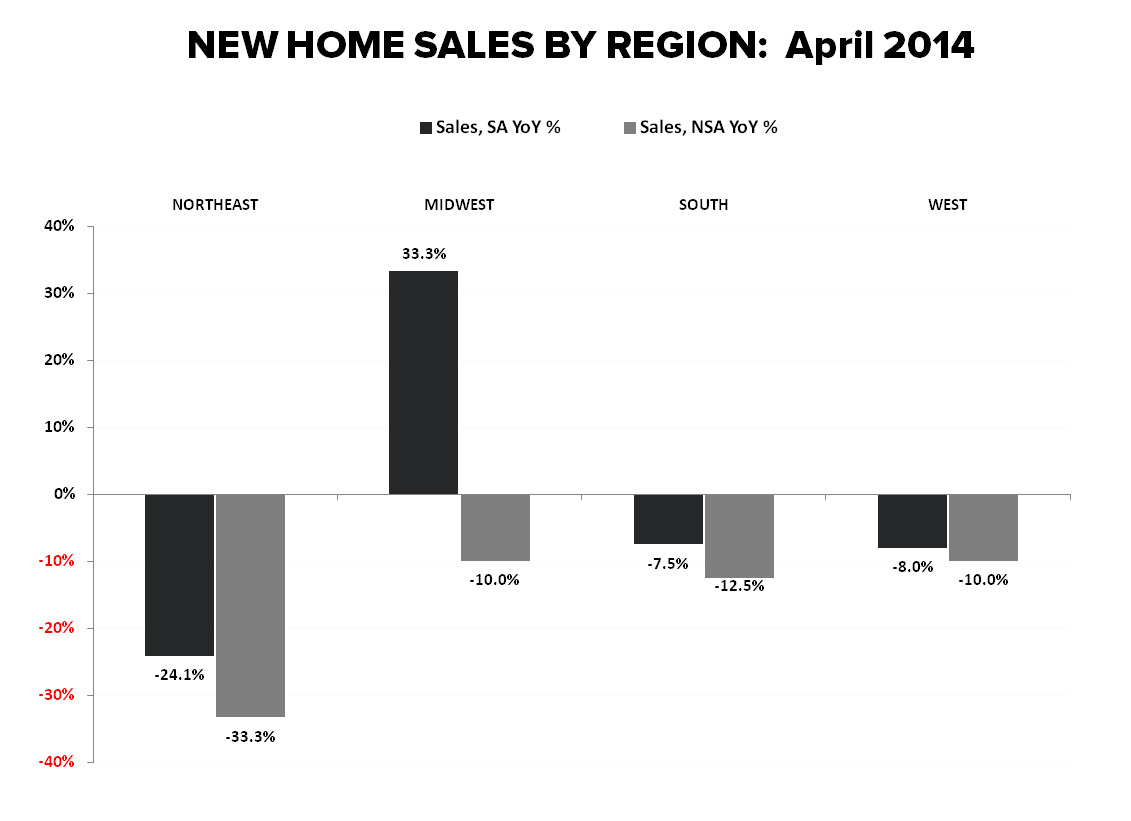
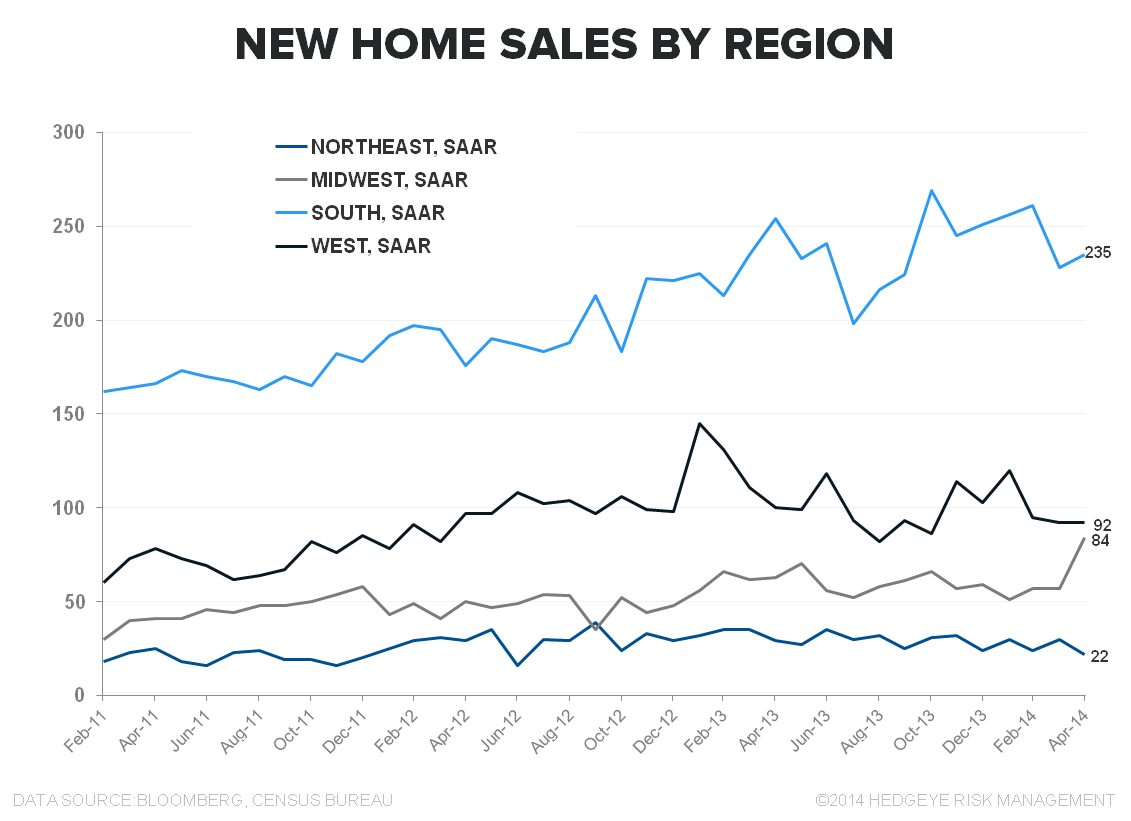
While the print is less bad on a year-over-year basis at -4% (vs -8% y/y last month), it's still going the wrong way. Moreover, sales were down across all regions again except for a seasonally-adjusted bounce in the Midwest. It's also worth noting that the inventory of new homes for sale ticked higher again this month.
The following is our recent take on the Starts & Permits data for purposes of comparison:
While total starts and permits bounced sharply in April vs March, the bounce was entirely attributable to multifamily. Single family starts and permits did not show any bounce from normalizing weather and continue to show slug-like progress in renormalizing back to pre-crisis levels. Multifamily starts and permits remain strong and are showing a nice, weather-related bounce, suggesting that rental demand continues to benefit from the conjunction of a strengthening labor market, ongoing household formation and QM’s negative effects on would-be first-time buyers.
Taking a look at the data, single family starts grew 5k month-over-month or 0.8% to 649k, while single family permits grew 2k, or 0.3% m/m to 602k. Multifamily starts, however, grew by an impressive 120k m/m (+39.6%) to 423k and permits were up 78k m/m, or +19.5% to 478k. Said differently, multifamily accounted for 96% of the growth in Starts and 98% of the growth in Permits month-over-month.
We think three factors are principally responsible for this weak 1H14 performance. First, QM rules that took effect on January 10 of this year are having a suppressing effect on credit availability. Second, institutional investor demand for properties is waning sharply. Third, affordability dynamics have swung sharply; whereas 12-18 months ago there was a strong asymmetry favoring homeownership, today renting vs owning are close to a toss-up.

About New Home Sales:
Each month the Census Department releases the New Home Sales report, which measures the number of newly constructed homes that have been sold in the month. The difference between the New Home Sales report and the Starts and Permits report is that New Home Sales only includes single family spec homes built and sold by builders, and does not include condos, apartments, or owner-built units. This is why New Home Sales typically run at roughly half the rate of Starts.
Joshua Steiner, CFA
Christian B. Drake
