SUMMARY:
1 for 5 on the day today for domestic macro data. You don’t get to play in October batting .200.
Inflation is rising, production is slowing, goods consumption is slowing, housing is slowing, initial claims are improving.
The 10Y going sub-2.5%, a burning dollar, Russell 2K down -8% YTD, and the 1600bps performance spread between XLU & XLY are telling a cohesive price story about growth expectations.
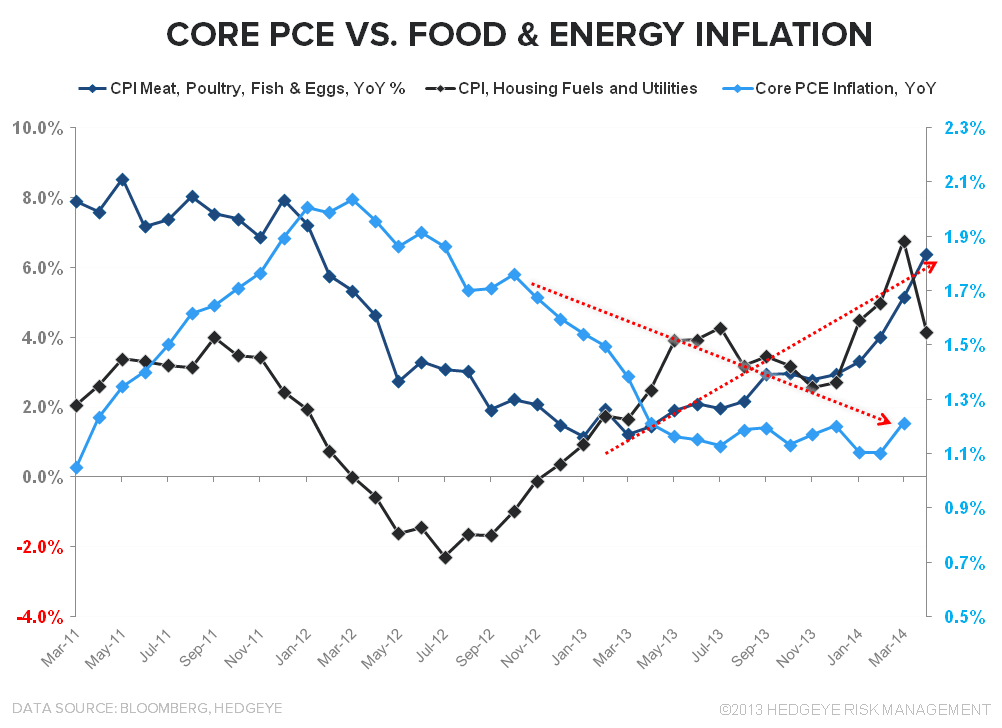
#InflationAccelerating: In short, it’s our simpleton view that the conflation of dollar depreciation and rising inflation serves to slow growth as food/energy/rent costs take down a rising share of the consumer’s wallet.
This is particularly true in an environment of flattish wage growth and when food, energy, and shelter (collectively ~55% of the CPI basket) cost growth is running at multiples of income growth.
Additionally, and perversely perhaps, the policy response to the growth slowdown only perpetuates it further as the pavlovian investor response to the expectation for (real or rhetorical) incremental easing continues to be to bid up commodities and other slow growth, inflation hedge assets. In variant forms, this dynamic has played out recurrently in the peri-QE periods over the last 5 years.
Headline CPI hit 2.0% for the first time since July of last year in April while Core CPI accelerated 10bps to +1.8% YoY, its fastest rate of growth in 13 months.
Notably, while shelter inflation (~31% weight) has almost singularly supported the headline number over the last year and food/energy inflation have been the outliers YTD, the rise in prices has been broader based the last few months.

As can be seen in the chart of CPI breadth below, the % of components showing sequential accelerating is beginning to show some 2011’esque mojo.
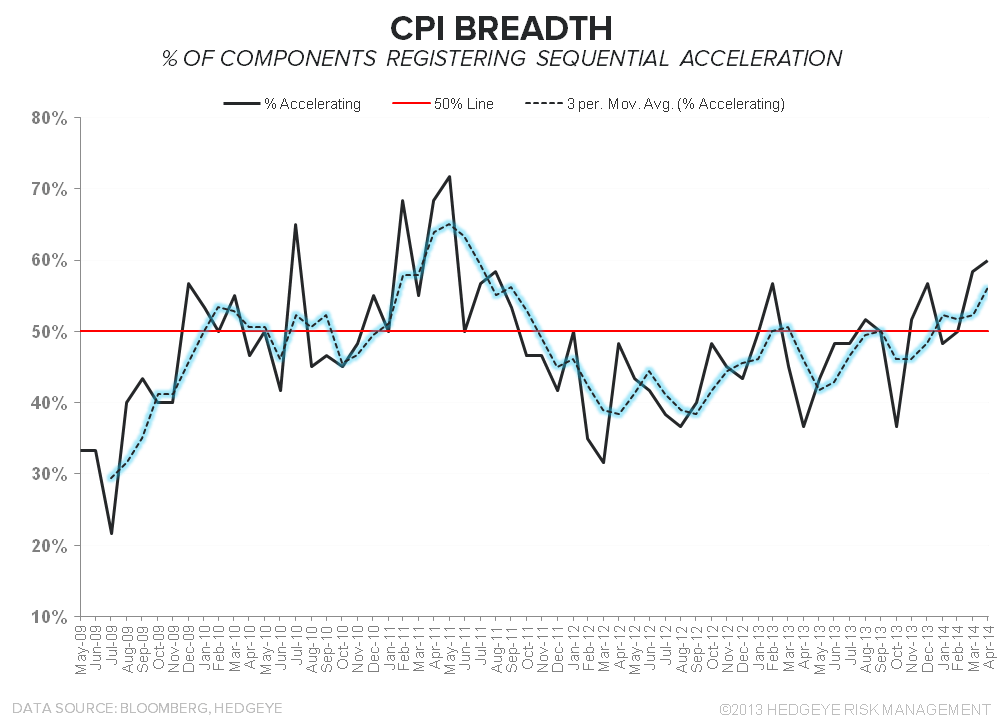
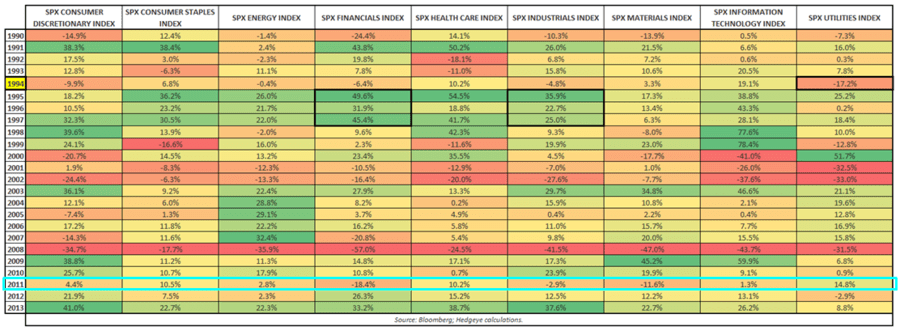
Through the lens of the reflexive inflation-growth-policy dynamic described above, it shouldn’t be a surprise that sector variance is looking a lot like 1H11.
INITIAL JOBLESS CLAIMS: Party Like It's 1999 ...
Josh Steiner, our Head of Financials research, provided this summary context with respect to this morning’s positive initial claims data:
The labor market is heading very much in the right direction again. This morning's data marked just the second time since 2007 that the SA print came in below 300k. As the chart below shows, 300k is a Rubicon of sorts in that it has historically coincided with levels of near-peak employment such as 1999 and 2006.
It's interesting to look at the contrast between then and now as the unemployment rate and NFP reports remain well off the levels seen in those respective timeframes.
The disconnect has largely to do with the long-term unemployed, both those being counted in the data and those who've dropped out of the work force, either due to disability or otherwise. If one excludes those in the long-term unemployed category one finds that the labor market today is functionally similar to that last seen in the '99 and '06 periods, albeit with much more modest wage inflation.
We would reiterate the question, however, that if claims are a measure of slack in the labor force and slack is tight it would seem reasonable to assume that wage inflation should be coming in the near future.
The one wrinkle here remains housing, which is showing plenty of signs of ongoing deceleration
source: Hedgeye Financials

INDUSTRIAL PRODUCTION/CAPACITY UTILIZATION: SEQUENTIAL SOFTNESS
Industrial production declined 0.6% MoM in April, decelerating on both a YoY and 2Y basis. The deceleration was pervasive across industries/sub-indices as capacity utilization dipped back below 79.
On balance, the April IP data largely agree with the previously released PMI figures which could generally be characterized as “okay”, but certainly not reflecting a recapture of significant, deferred demand from 1Q.
So, in the battle for accelerating wage inflation, improving initial jobless claims, positive trends in short term unemployment and declining productivity continue to be counterbalanced by ongoing weakness in broader employment measures, middling manufacturing activity and capacity utilization figures, a slowdown in housing, and ongoing softness in household credit and business capex growth.

NAHB HOMEBUILDER SURVEY: THE SLUMP IN CONFIDENCE CONTINUES
We touched on the NAHB data in the inaugural launch of the Hedgeye Housing research vertical this morning - BUILDER CONFIDENCE SLUMPS AGAIN - but the takeaway is rather straightforward = #HousingSlowdown continues.
The NAHB HMI declined to 45 in May, declining from a downwardly revised April reading of 46. The slowdown remained geographically pervasive with the cratering of sentiment in the West region again leading the declines.
The builder “optimism spread” (6M expectations less Current Traffic) continued to expand as well – not a particularly favorable harbinger historically.

Christian B. Drake
@HedgeyeUSA
