Welcome to The Hedgeye Housing Research Vertical
Today we are introducing our inaugural Hedgeye Housing Vertical research product. The effort is being led by Josh Steiner and Christian Drake from the Financials and Macro teams. Subscribers to Financials and/or Macro verticals are currently set up to receive this product. If you'd prefer not to receive our housing-focused research going forward please let us know.
Our goal is to help investors understand the trends and spot inflection points in the US housing market by tracking 15-20 different housing data series and presenting them in a hyper-simple format. Whenever data hits we will publish a brief note summarizing its importance, or lack thereof. Our Hedgeye Housing Compendium table (below) aspires to present the state of the housing market in a visually-friendly format that takes about 30 seconds to consume.
We've broken the market into four main categories: Home Prices, the existing home market, the new home market, and other miscellaneous data. The focus is on simple supply and demand measurements and whether they're weakening or strengthening, on the margin. We're using red and green to make it easy for investors to gauge, at a glance, whether there's widespread improvement, deterioration or a mixed bag.
As the housing research effort evolves we hope you'll engage us with questions and feedback.

THE BULLS TURN BEARISH: Summarizing the Evolution of our Call
After being discretely bullish on housing for the better part of a year beginning in 4Q12, we turned increasingly negative at the beginning of the year and elevated #HousingSlowdown to a top Macro theme for 2Q14.
The 2Q14 Macro Investment Themes presentation detailing our expectation for an intermediate term slowdown in housing can be found HERE
Additionally, we’ve compiled ~300 housing related research notes that had previously been published within the Financials vertical. That research is now available for review in the new Hedgeye Housing vertical on our website.
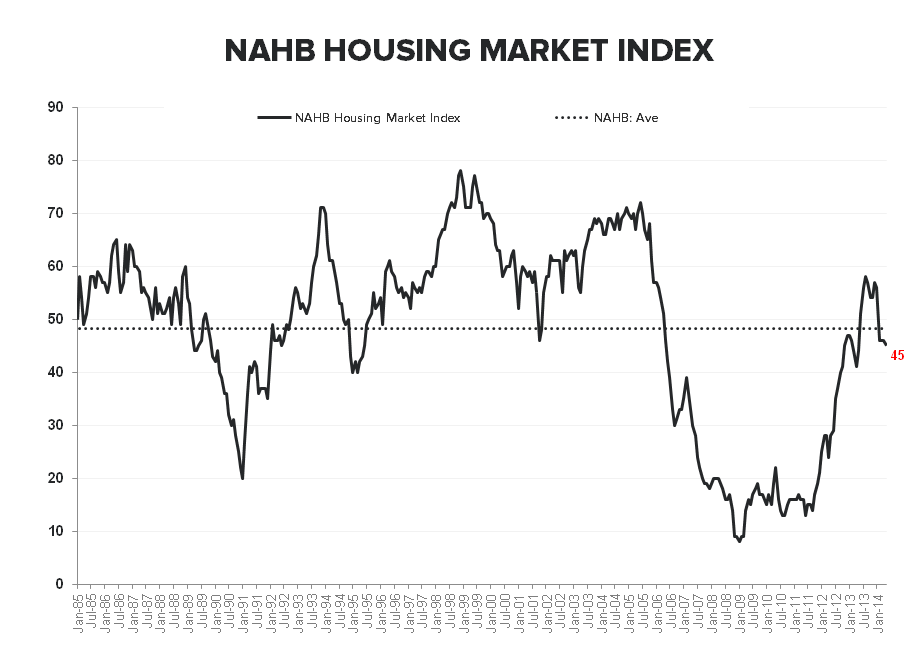
Today's Focus: NAHB HMI (Builder Confidence Survey)
This month, the NAHB’s HMI, which measures builder confidence, fell to 45, a drop of one point from April’s print of 46 (which was downwardly revised from 47).
This is the fourth consecutive month of decline/stagnation. While NAHB Chairman Kevin Kelly interprets this as “in line with the market reality of a continuing but modest recovery,” we see it as a clear inflection from the path housing had been on between June 2013 and January 2014, when the HMI posted its strongest post-housing crisis prints (ranging from 51-58).
In February of this year, the index dropped 10 points to 46 with the weakness extending through the latest reading. It's notable that the step function move lower in builder confidence has been geographically pervasive and has persisted in the face of the positive turn in the weather. Though these prints are still well above those of 2008-2011, they do not suggest a housing market in the midst of an accelerated comeback.
At the sub-index level, the components that make up the HMI were mixed. That gauging current sales conditions fell from 50 in April to 48 in May. The component measuring buyer traffic increased two points to 33, and the component gauging sales expectations during the next six months rose from 56 to 57. Once again, these numbers do not speak to great strength; the NAHB expects only a one point increase in sales until the end of 2014.
On a regional level, builder confidence remains strongest in the South and weakest in the Northeast. The only significant movement in regional HMIs was a four-point drop in the West, where the significant and expedited drawdown from the January peak of 71 to 44 in May further extended itself.
While the last four months’ prints have been stronger than those of 2008-2011, they remain weak in comparison to 2013's rising prints. Don’t let ABC News Nightline talk of bidding wars fool you; the recovery is losing momentum and the appropriate question from here is how low will it go?


About the NAHB HMI:
The Housing Market Index (HMI) is based on a monthly survey of NAHB members designed to take the pulse of the single-family housing market. The monthly survey has been conducted for 30 years. The survey asks respondents to rate market conditions for the sale of new homes at the present time and in the next 6 months as well as the traffic of prospective buyers of new homes. The HMI is a weighted average of separate diffusion indices for these three key single-family series. The HMI can range from 0 to 100, where a value over 50 implies conditions are, on average, improving, a value below 50 implies conditions are worsening, and an index value of 50 indicates that the housing market is neither improving nor worsening.
Joshua Steiner, CFA
Christian B. Drake