Investment Company Institute Mutual Fund Data and ETF Money Flow:
In the most recent 5 day period, the combination of taxable and tax-free bond funds had the best week all year with $5.5 billion in inflow, well above the running year-to-date average of $1.9 billion. Conversely, equity funds had a very light inflow of just $754 million, well below the year-to-date average of $3.3 billion.
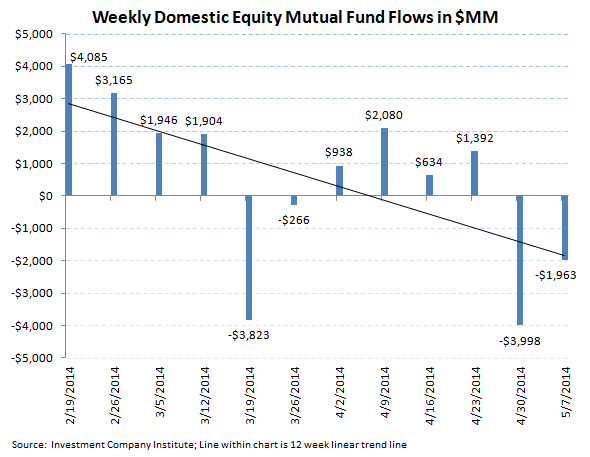
It was an anemic week for equity mutual fund and ETF trends. Total equity mutual fund flows experienced slight relief w/w, improving sequentially from a net outflow last week, but still producing a tally well below the 2014 year-to-date weekly average. The $754 million that flowed into all equity mutual funds during the most recent 5 day period ending May 7th was split between a $2.0 billion outflow from domestic equity funds and $2.7 billion inflow into international equity funds. This outperformance from foreign equity products has been consistent over the past two years; international stock fund inflow has averaged $2.6 billion per week thus far this year, on par with 2013's $2.6 billion inflow, while domestic fund trends have averaged an inflow of just $770 million thus far in '14 and $451 million inflow in '13. The 2014 running weekly average inflow for all equity mutual funds is now $3.3 billion, only a slight improvement from the $3.1 billion weekly average inflow from 2013.
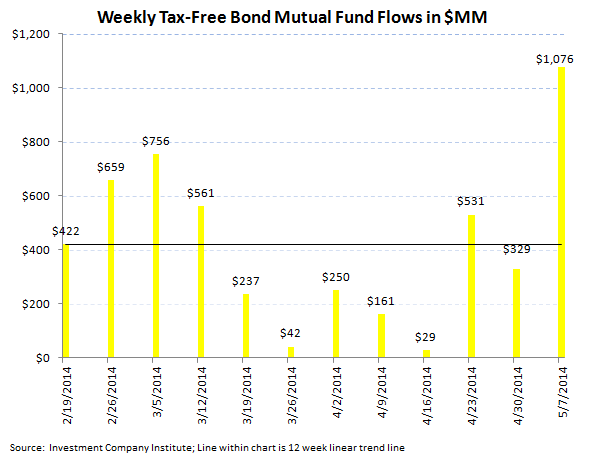
Conversely, fixed income mutual fund flows accelerated notably on a w/w basis. For the five day period ending May 7th, $5.5 billion flowed into all fixed income funds, as opposed to last week's much weaker $931 million inflow. The improvement in bond fund flow this week was the result of $4.4 billion that flowed into taxable products and $1.1 billion that flowed into tax-free or municipal products. The inflow into taxable products this week was the 13th consecutive week of positive flow and the inflow into municipal or tax-free products was the 17th consecutive week of positive subscriptions. The 2014 weekly average for fixed income mutual funds now stands at a $1.9 billion weekly inflow, a vast improvement from 2013's weekly average outflow of $1.5 billion, but still a far cry from the $5.8 billion weekly average inflow from 2012 (our view of the blow off top in bond fund inflow).
ETFs had polarized trends this week, with a substantial weekly redemption in equity ETFs and a solid week for bond ETFs. Equity ETFs experienced an $8.7 billion outflow w/w, while Fixed Income ETFs experienced $3.0 billion in inflows. The previous week saw a $4 billion inflow into stock ETFs and a $818 million inflow into bond ETFs. The 2014 weekly averages are now a $385 million weekly inflow for equity ETFs and a $1.0 billion weekly inflow for fixed income ETFs.
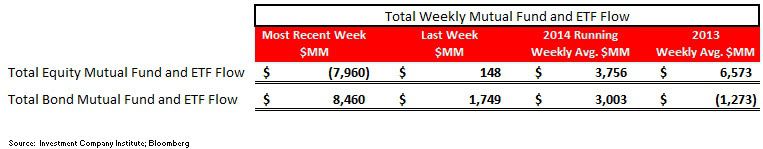
The net of total equity mutual fund and ETF trends against total bond mutual fund and ETF flows totaled a negative $16.4 billion spread for the week ($8.0 billion of total equity outflow versus the $8.5 billion inflow within fixed income; positive numbers imply greater money flow to stocks; negative numbers imply greater money flow to bonds). The 52 week moving average has been $7.4 billion (more positive money flow to equities), with a 52 week high of $31.0 billion (more positive money flow to equities) and a 52 week low of -$37.5 billion (negative numbers imply more positive money flow to bonds for the week).
Mutual fund flow data is collected weekly from the Investment Company Institute (ICI) and represents a survey of 95% of the investment management industry's mutual fund assets. Mutual fund data largely reflects the actions of retail investors. Exchange traded fund (ETF) information is extracted from Bloomberg and is matched to the same weekly reporting schedule as the ICI mutual fund data. According to industry leader Blackrock (BLK), U.S. ETF participation is 60% institutional investors and 40% retail investors.

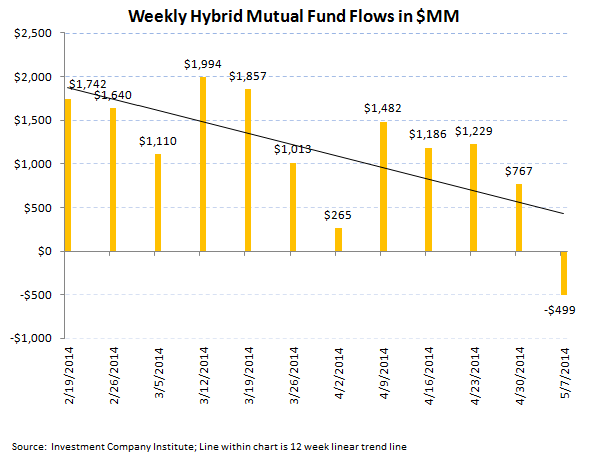
Most Recent 12 Week Flow in Millions by Mutual Fund Product:


Most Recent 12 Week Flow Within Equity and Fixed Income Exchange Traded Funds:


Net Results:
The net of total equity mutual fund and ETF trends against total bond mutual fund and ETF flows totaled a negative $16.4 billion spread for the week ($8.0 billion of total equity outflow versus the $8.5 billion inflow within fixed income; positive numbers imply greater money flow to stocks; negative numbers imply greater money flow to bonds). The 52 week moving average has been $7.4 billion (more positive money flow to equities), with a 52 week high of $31.0 billion (more positive money flow to equities) and a 52 week low of -$37.5 billion (negative numbers imply more positive money flow to bonds for the week).

Jonathan Casteleyn, CFA, CMT
Joshua Steiner, CFA
