
Consumer Staples outperformed the broader market last week, rising 0.7% versus the S&P500 at -0.1%. XLP is up 3.7% year-to-date vs the SPX at 1.6%.
Earnings Calls (in EST):
Monday (5/12): RDEN (4:30pm)
Wednesday (5/14): SFD (8am); SODA (8:30am)
Thursday (5/15): FLO (8:30am)
For the last two months, XLP is bullish on immediate term TRADE and intermediate term TREND durations from a quantitative set-up.

The Hedgeye U.S. Consumption Model has shown steady improvement over the past three weeks, from only 3 of the 12 metrics flashing green to now 8 of 12.

Despite the bullish quantitative and consumption set-up for the sector, we continue to believe that the group is facing numerous headwinds, including:
- U.S. consumption growth is slowing as inflation rises, in-line with the Macro team’s 1Q14 theme of #InflationAccelerating, and Q2 2014 theme of #ConsumerSlowing
- The economies and currencies of the emerging market – once the sector’s greatest growth engine – remain weak with the prospect of higher inflation in 2014 eroding real growth
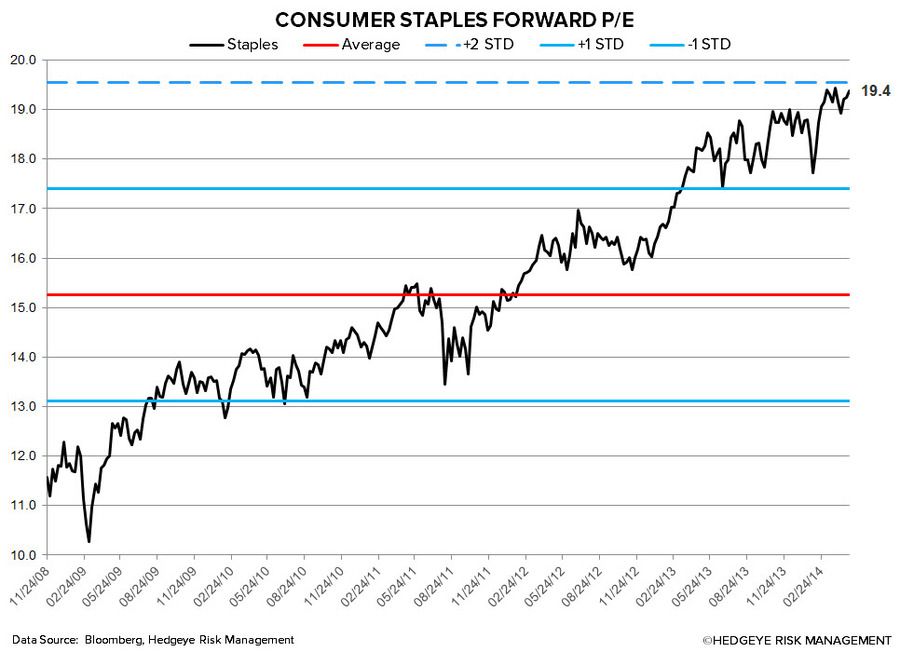
- The sector is loaded with a premium valuation (P/E of 19.4x)
- Less sector Yield Chasing as Fed continues its tapering program
- The high frequency Bloomberg weekly U.S. Consumer Comfort Index (recently rescaled for cosmetic and not component reasons) has not seen any real improvement over the past 6 months, and fell to 37.1 versus 37.9 in the prior week


Top 5 Week-over-Week Divergent Performances:
Positive Divergence: HAIN 5.4%; TAP 5.3%; HSH 3.9%; SJM 3.3%; BUD 2.6%
Negative Divergence: NUS -13.55; POST -9.1%; TSN -7.6%; BNNY -7.3%; SAM -7.1%
Last Week’s Research Notes
Quantitative Setup
In the charts below we look at the largest companies by market cap in the Consumer Staples space from both a quantitative perspective and fundamental aspect where we can offer one. As you will see over time, sometimes our fundamental view does not align with the quantitative setup (though not often).
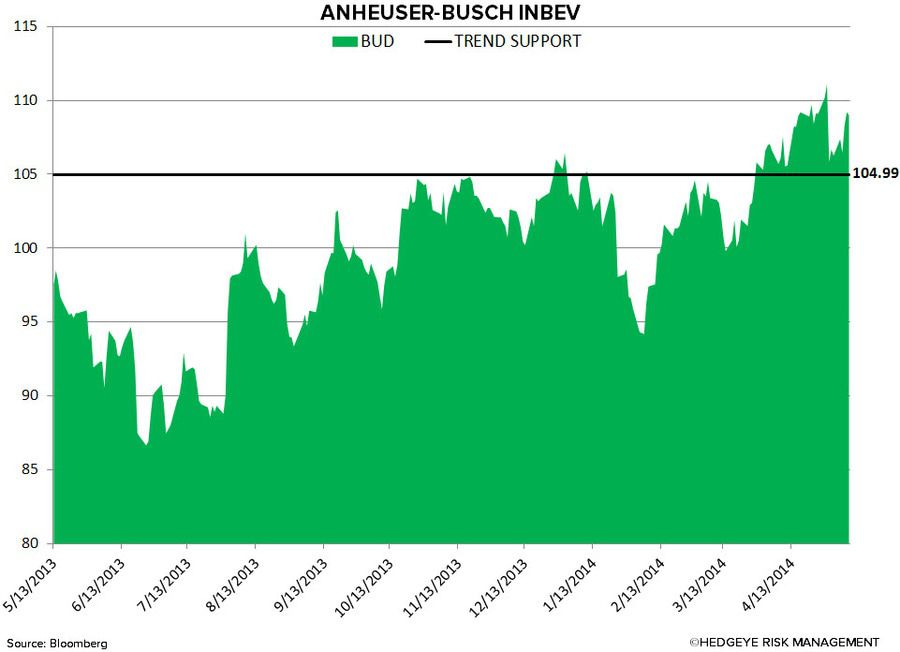
BUD – bullish big-cap-low-beta breakout (style factor working, big time, in US Equities right now) continues; intermediate-term TREND support = $104.99
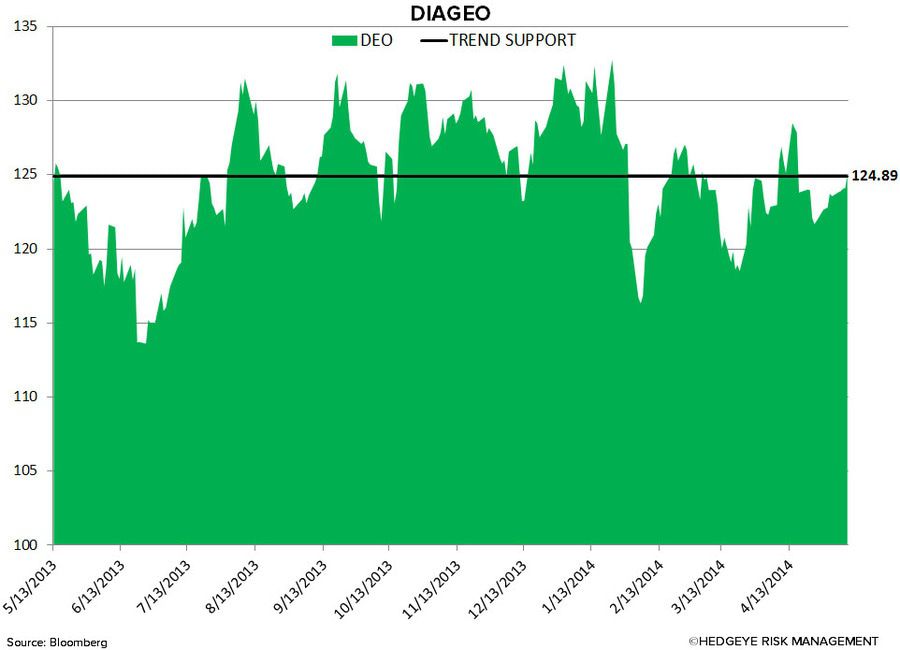
DEO – finally joins the style factor fun and recaptures bullish TREND support of $124.89, barely
KO – big breakout from mid-April continues to hold; slow-growth-big-cap-low-beta continues to work; $39.52 TREND support

PEP – bullish intermediate-term TREND continues as all the style factors this stock holds remain well bid; $84.09 TREND support

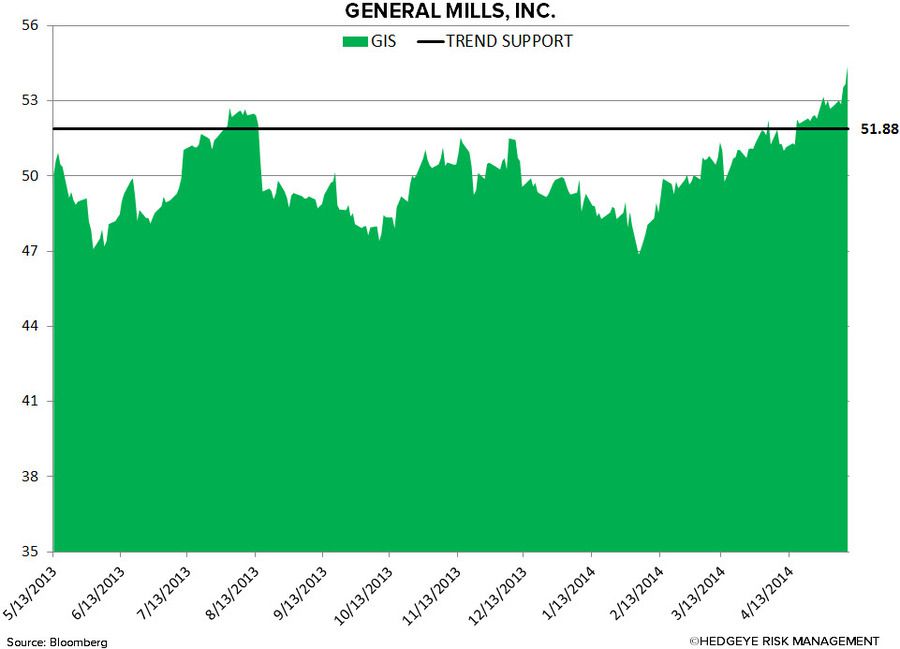
GIS – this name has been singing cheerio to us since the TREND breakout in FEB 2014; $51.88 TREND support
MDLZ – straight up after solidifying its TREND base at $35.03

KMB – one of the least overbought on the list, but still one of the best looking longs; TREND support = $107.78

PG – intermediate-term TREND breakout from APR 2014 confirmed; TREND support = $80.84

MO – getting exhausted on the upside but remains bullish TREND ($38.38 support) nevertheless

PM – bearish to bullish TREND reversal confirming itself in the last few weeks; what was TREND resistance is now support at $83.14

Howard Penney
Managing Director
Matt Hedrick
Associate
Fred Masotta
Analyst
