Investment Company Institute Mutual Fund Data and ETF Money Flow:
In the most recent 5 day period, absolute money flow into both equity and fixed income mutual funds fell week-to-week, with domestic equity funds booking the biggest outflow all year.
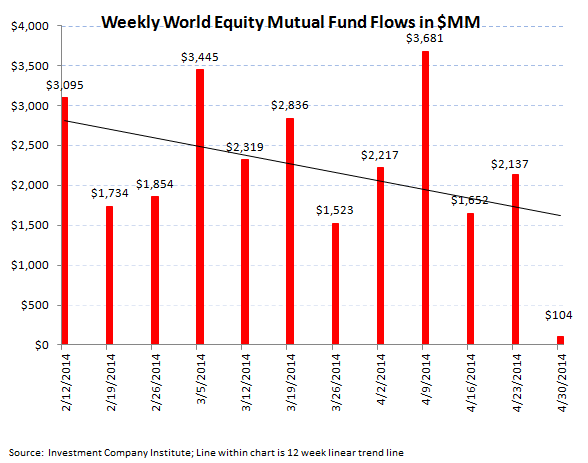
Total equity mutual fund flows had their biggest redemptions year-to-date with over $3.8 billion being yanked from stock funds with the leading culprit the U.S. domestic stock category. Of the $3.8 billion that flowed out of all equity mutual funds during the most recent 5 day period ending April 30th, $3.9 billion came out from domestic equity funds which was saved by a slight $104 million inflow from international stock funds. This outperformance from foreign equity products has been consistent over the past two years with international stock fund inflow having averaged $2.5 billion per week thus far this year in addition to the $2.6 billion inflow averaged per week last year in 2013 versus domestic fund trends averaging an inflow of just $932 million thus far in '14 and a $451 million inflow last year in comparison. The 2014 running weekly average inflow for all equity mutual funds is now $3.5 billion, a slight improvement from the $3.0 billion weekly average inflow from 2013.
Fixed income mutual fund flow also decelerated on a w/w basis, although managing to leg out a slight inflow for the week. For the five day period ending April 30th, $931 million flowed into all fixed income funds, as opposed to last week's much stronger $2.3 billion inflow. The deterioration of bond fund inflow this week was the result of only $602 million that flowed into taxable products and $329 million that flowed into tax-free or municipal products. The inflow into taxable products this week was the 12th consecutive week of positive flow and the inflow into municipal or tax-free products was the 16th consecutive week of positive subscriptions. The 2014 weekly average for fixed income mutual funds now stands at a $1.8 billion weekly inflow, a vast improvement from 2013's weekly average outflow of $1.5 billion, but still a far cry from the $5.8 billion weekly average inflow from 2012 (our view of the blow off top in bond fund inflow).
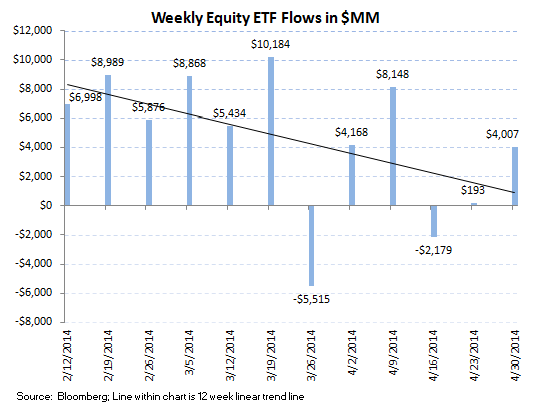
ETFs had a strong showing this week, with a notable weekly subscription for equity ETFs, which experienced an inflow of $4.0 billion. The previous week saw only $193 million inflow into stock ETFs. Bond ETFs fell slightly this week, still, the $818 million inflow was only slightly below the previous week's $1.2 billion inflow. The 2014 weekly averages are now a $920 million weekly inflow for equity ETFs and a $896 million weekly inflow for fixed income ETFs.
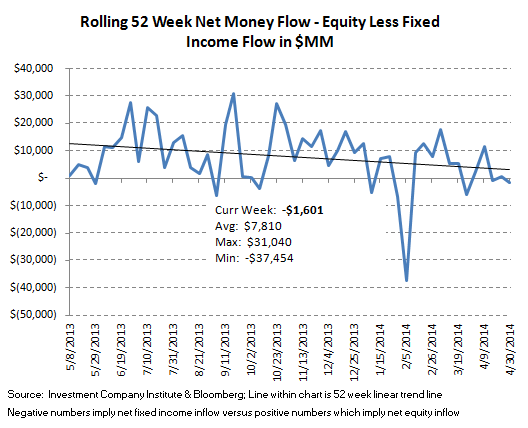
The net of total equity mutual fund and ETF trends against total bond mutual fund and ETF flows totaled a negative $1.6 billion spread for the week ($148 million of total equity inflow versus the $1.7 billion inflow within fixed income; positive numbers imply greater money flow to stocks; negative numbers imply greater money flow to bonds). The 52 week moving average has been $7.8 billion (more positive money flow to equities), with a 52 week high of $31.0 billion (more positive money flow to equities) and a 52 week low of -$37.5 billion (negative numbers imply more positive money flow to bonds for the week).
Mutual fund flow data is collected weekly from the Investment Company Institute (ICI) and represents a survey of 95% of the investment management industry's mutual fund assets. Mutual fund data largely reflects the actions of retail investors. Exchange traded fund (ETF) information is extracted from Bloomberg and is matched to the same weekly reporting schedule as the ICI mutual fund data. According to industry leader Blackrock (BLK), U.S. ETF participation is 60% institutional investors and 40% retail investors.

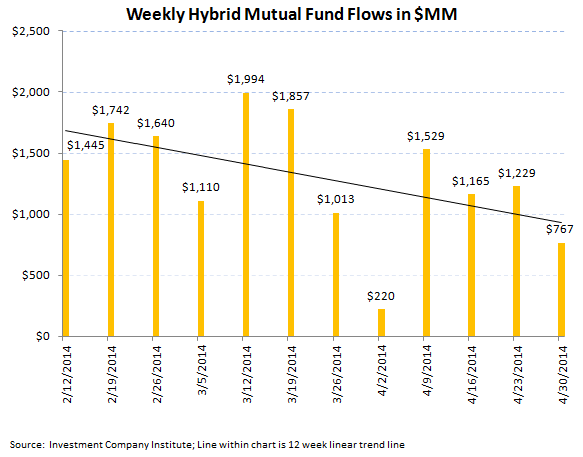
Most Recent 12 Week Flow in Millions by Mutual Fund Product:


Most Recent 12 Week Flow Within Equity and Fixed Income Exchange Traded Funds:

Net Results:
The net of total equity mutual fund and ETF trends against total bond mutual fund and ETF flows totaled a negative $1.6 billion spread for the week ($148 million of total equity inflow versus the $1.7 billion inflow within fixed income; positive numbers imply greater money flow to stocks; negative numbers imply greater money flow to bonds). The 52 week moving average has been $7.8 billion (more positive money flow to equities), with a 52 week high of $31.0 billion (more positive money flow to equities) and a 52 week low of -$37.5 billion (negative numbers imply more positive money flow to bonds for the week).
Jonathan Casteleyn, CFA, CMT
Joshua Steiner, CFA
