This note was originally published at 8am on April 22, 2014 for Hedgeye subscribers.
“Nothing entirely disappears in history.”
-T.J. Stiles
But the US stock market’s volume in the last 5 trading days almost has…
#History, as eloquently defined by T.J. Stiles in The First Tycoon – The Epic Life of Cornelius Vanderbilt, is “threads of tattered old fabric – especially social fabric – ever woven into new tapestries.” (pg 79)
Especially on the Old Wall, what’s stale to you and I eventually becomes the new. More commonly called consensus, it’s the art of front-running storytelling that makes us money. No pattern of predictable market behavior entirely disappears; especially with the benefit of looking in the rear-view mirror.
Back to the Global Macro Grind…
So let me tell you a story this morning about Vanishing Volume. As with any good story, you need a good headline. After I effectively failed my first creative writing course in New Haven, a nice young professor taught me alliteration. Two v’s. Yep, so easy a Mucker can do it.

What’s not easy for the financial media to tell you are original content stories that require a basic level of algebra and a contextual overlay (you know, something like, say, a time series… so that you can see something meaningful, like the rate of change).
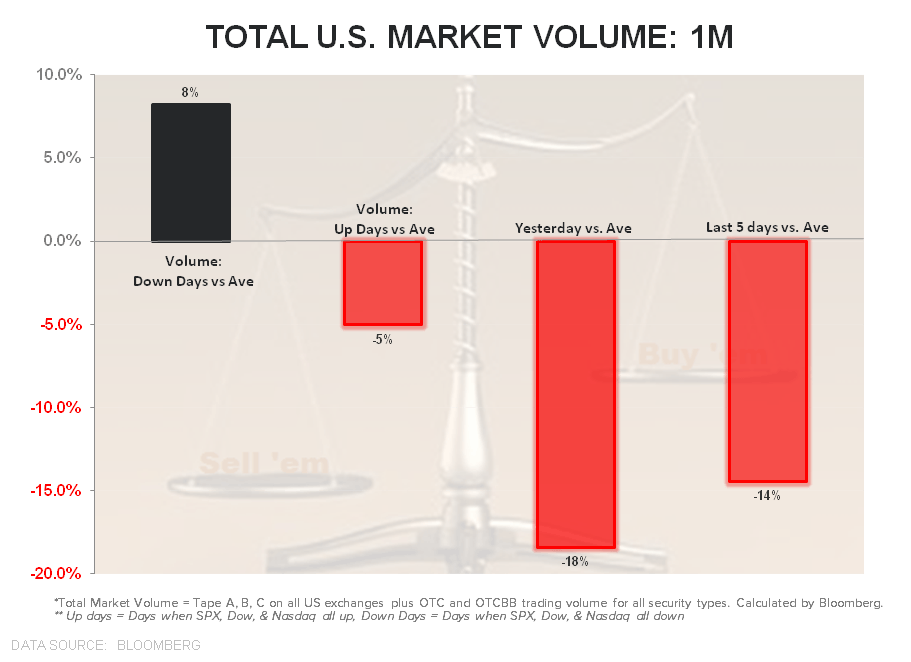
Usually, it’s easier to show these historical matters in pictures. So, instead of reading my rant, you can just skip to Christian Drake’s Chart of The Day and get the point. What we’re showing you here is the lack of buying conviction (i.e. total US equity market volume, across all exchanges):
- Volume on DOWN DAYS = +8% versus the 1 month average
- Volume on UP DAYS = -5% versus the 1 month average
- Yesterday’s volume (an UP DAY) was -18% versus the 1 month average
Fair enough. Since it feels like half of America took the day off again yesterday, you can accuse me of cherry picking that one nasty day of no-volume. So I’ll broaden my horizons to the last 5-days. UP day volume was -14% versus the average.
Now, if you only use a Moving-Monkey (more commonly called a simple 50 or 200 day moving average), you don’t care about risk factors like this. Single-factor (price only) models are point and click. My 6yr old can do it on Yahoo Finance. No underneath the hood analysis of volume or volatility required.
In my process (studying fractal patterns, returns, draw-downs, etc. of US stocks), using a multi-factor model is critical. And to be clear, it’s not that I have anything against monkeys… I used to use those things too (newsflash: they don’t work).
What’s the alternative? As a basic predictive signal, what works?
- Price UP, Volume ACCELERATING, and Implied Volatility FALLING = bullish
- Price DOWN, Volume ACCELERATING, and Implied Volatility RISING = bearish
- PRICE UP on DOWN VOLUME and Implied Volatility unchanged = bad
And really bad if you go all multi-duration and cross-asset-class (more factors) in your analysis!
So let’s go there.
- SP500 broke out (on no volume) above its intermediate-term TREND support of 1834, but failed at immediate-term TRADE resistance of 1887
- Nasdaq didn’t breakout above either my TRADE or TREND lines (bearish TREND with no support to fresh YTD lows)
- Russell2000 didn’t breakout above my TRADE or TREND lines of resistance either
- US Dollar Index bounced to lower-highs but remains below my TAIL risk line of $81.17 resistance
- US Bond Yield (10yr US Treasury) bounced to lower-highs but remains below my intermediate-term TREND resistance of 2.81%
- Nikkei (which is the upside down of the UP Yen vs USD move) failed at 14,835 TRADE resistance overnight = bearish TREND (-11% YTD)
I can keep going deeper and delve into the depths (more alliteration – see, I can do this without Janet – Yes I Can!) of the non-linear ecosystem that is the Global Macro Market – but I will not… because every good line of storytelling needs to simplify the complex.
What will be extra complex is seeing how Goldman and Credit Suisse explain their “buy Facebook (FB)” call from yesterday if my WhatsApp! man Zuck doesn’t deliver the 14x revenue bacon tomorrow. As for the buy Apple (AAPL) ahead of the quarter thing, that’s not how I roll.
I’m a macro man, so my main focus into and out of earnings events will be how the bubbles (Biotech and Social Media) trade after making lower-highs on lower-volumes. Biotech (IBB) was +2.3% yesterday but remains below @Hedgeye TREND resistance.
Oh, and Housing stocks (ITB) made fresh 2014 lows yesterday (-5.3% YTD), but let’s not story-tell about vanishing housing demand (while rates are falling) until tomorrow…
Our immediate-term Global Macro Risk Ranges are now (12 Big Macro ranges in our Daily Trading Range product):
SPX 1834-1887
VIX 12.39-15.90
USD 79.32-80.15
EUR/USD 1.37-1.39
Pound 1.67-1.69
Gold 1284-1309
Best of luck out there today,
KM
Keith R. McCullough
Chief Executive Officer
