A strong jobs report this morning indicated a 288,000 gain in employment in April, greater than the 218,000 that economists forecasted. This marks the largest gain since January 2012. In addition, unemployment plunged from 6.7 to 6.3% in the month largely due to fewer people entering the labor force. That last point suggests that the underlying trends may not be as rosy as the headline numbers would indicate.
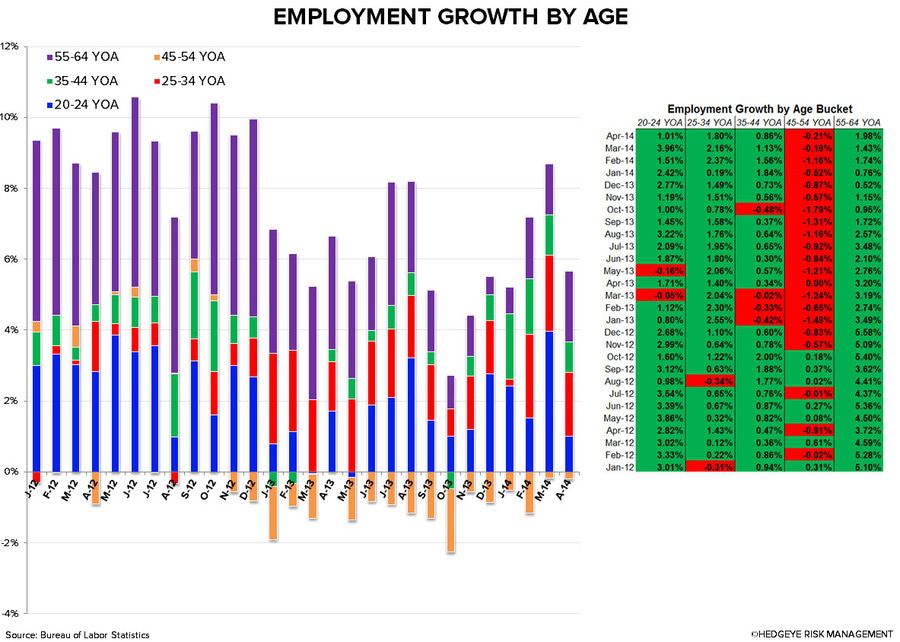
We received mixed results this morning from the BLS pertaining to restaurant industry employment and we do have a few notable callouts. The 20-24 YOA cohort had its second lowest month of employment growth since June 2013, which is a bearish data point for quick-service restaurants. The 45-54 YOA cohort also continued its employment slump, as April marked the 18th consecutive month of employment deterioration. This is, in our view, a material headwind to casual dining restaurants and is part of the reason that industry is in secular decline. On the other hand, the 55-64 YOA cohort had its best month of employment growth since July 2013 and is, all told, a bullish data point for the casual dining industry.
In aggregate, the report was slightly disappointing for the restaurant industry as all age buckets, aside from the 55-64 YOA cohort, reported a sequential decline in employment growth. With that being said, we continue to favor select fast casual and quick service operators over casual dining operators, despite being bullish on both DRI and BOBE as special situation plays.
April employment growth data:
- 20-24 YOA: +1.01% YoY; -295.3 bps sequentially
- 25-34 YOA: +1.80% YoY; -35.8 bps sequentially
- 35-44 YOA: +0.86% YoY; -27.2 bps sequentially
- 45-54 YOA: -0.21% YoY; -2.5 bps sequentially
- 55-64 YOA: +1.98% YoY; +55.0 bps sequentially
Despite the sequential decline in employment growth in most age buckets, employment growth across full-service restaurants, limited-service restaurants, and leisure & hospitality continues to grow at a fairly healthy clip. However, we’d note that employment in limited-service restaurants remains the most robust and caution that growth across all three segments remains well below June 2013 levels.


In the chart below, we look at the correlation between TTM Leisure & Hospitality Employment Growth and TTM Knapp Comps. Historically, Knapp same-store sales have tracked well with employment growth in the leisure & hospitality industry, however, this positive correlation began to break down in mid-2012. This trend continues, supporting our case that the casual dining industry is in secular decline. In this type of environment, we continue to believe that only the most nimble and innovative players will thrive.

Howard Penney
Managing Director
Fred Masotta
Analyst
