Investment Company Institute Mutual Fund Data and ETF Money Flow:
In the most recent week, slightly positive fixed income trends outflanked weakened domestic equity trends which is leading to noticeably improving bond flows on a 12 week basis. Despite the slope of the line improvement near term in fixed income however, quarter-to-date flows still greatly favor equity funds which continues to support our long recommendation of T Rowe Price:
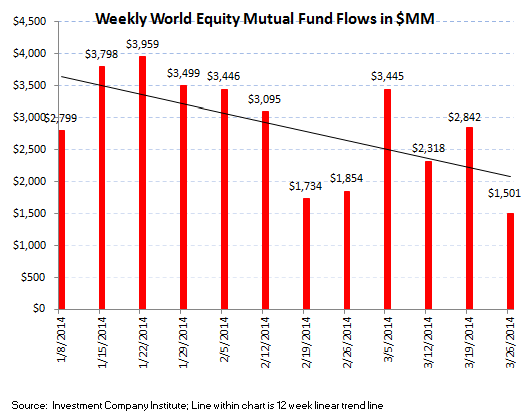
Total equity mutual funds produced a slight net inflow during the most recent 5 day period with domestic fund outflows offset by international equity inflows. Domestic stock funds lost $267 million in the week ending March 26th, an improvement from the $3.8 billion redemption the week prior but none-the-less the second consecutive week of outflow in U.S. stock funds. The total stock fund category however was bolstered by the $1.5 billion that flowed into international stock mutual funds which netted to a positive result for the category during the week. Despite the choppy trends, the 2014 running weekly average inflow for equity mutual funds is now $4.0 billion, still an improvement from the $3.0 billion weekly average inflow for 2013.
Fixed income mutual funds trends decelerated from the week prior but none-the-less continued on a more positive path than weakening equity trends. The breakout of steadying bond fund inflow amounted to $1.2 billion into taxable products and a $49 million inflow into tax-free or municipal products. The inflow into taxable products in the week ending March 26th was the 7th consecutive week of positive flow and the inflow into municipal or tax-free products was the 11th consecutive week of positive subscriptions. The 2014 weekly average for fixed income mutual funds now stands at a $1.8 billion weekly inflow, an improvement from 2013's weekly average outflow of $1.5 billion but a far cry from the $5.8 billion weekly average inflow from 2012 (our view of the blow off top in bond fund inflow).
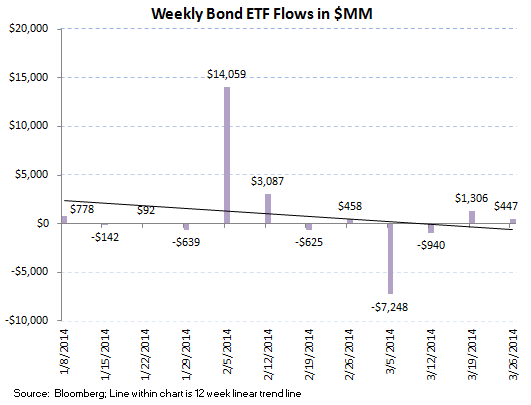
ETFs experienced volatile trends during the week, with a moderate decline in stock ETF trends with $5.5 billion in net redemptions with bond ETFs experiencing a slightly inflow of $447 million for the 5 day period. The 2014 weekly averages are now a $108 million weekly inflow for equity ETFs and a $886 million weekly inflow for fixed income ETFs.
The net of total equity mutual fund and ETF trends against total bond mutual fund and ETF flows totaled a negative $6.0 billion spread for the week ($4.2 billion of total equity outflow versus the $1.7 billion inflow within fixed income; positive numbers imply greater money flow to stocks; negative numbers imply greater money flow to bonds). The 52 week moving average has been $7.1 billion (more positive money flow to equities), with a 52 week high of $31.0 billion (more positive money flow to equities) and a 52 week low of -$37.4 billion (negative numbers imply more positive money flow to bonds for the week).
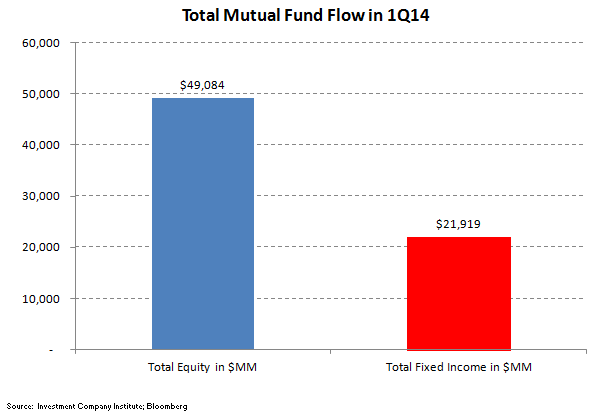
With the first quarter of the 2014 in the books, the running total of equity and fixed income funds continues to favor the stock side of the ledger. Total equity mutual fund flow (domestic and international) amounted to $49 billion quarter-to-date, over double the $21 billion that has come into all bond funds (taxable and tax free products), so despite the short term momentum in bond funds, the equity category is still better for now. These quarterly totals continue to support our long recommendation in shares of T Rowe Price (TROW), which we estimate will have the best results in the upcoming earnings season.
Mutual fund flow data is collected weekly from the Investment Company Institute (ICI) and represents a survey of 95% of the investment management industry's mutual fund assets. Mutual fund data largely reflects the actions of retail investors. Exchange traded fund (ETF) information is extracted from Bloomberg and is matched to the same weekly reporting schedule as the ICI mutual fund data. According to industry leader Blackrock (BLK), U.S. ETF participation is 60% institutional investors and 40% retail investors.

Most Recent 12 Week Flow in Millions by Mutual Fund Product:


Most Recent 12 Week Flow Within Equity and Fixed Income Exchange Traded Funds:

Net Results:
The net of total equity mutual fund and ETF trends against total bond mutual fund and ETF flows totaled a negative $6.0 billion spread for the week ($4.2 billion of total equity outflow versus the $1.7 billion inflow within fixed income; positive numbers imply greater money flow to stocks; negative numbers imply greater money flow to bonds). The 52 week moving average has been $7.1 billion (more positive money flow to equities), with a 52 week high of $31.0 billion (more positive money flow to equities) and a 52 week low of -$37.4 billion (negative numbers imply more positive money flow to bonds for the week).

With the first quarter of the 2014 in the books, the running total of equity and fixed income funds continues to favor the stock side of the ledger. Total equity mutual fund flow (domestic and international) amounted to $49 billion quarter-to-date, over double the $21 billion that has come into all bond funds (taxable and tax free products), so despite the short term momentum in bond funds, the equity category is still better for now. These quarterly totals continue to support our long recommendation in shares of T Rowe Price (TROW), which we estimate will have the best results in the upcoming earnings season.
Jonathan Casteleyn, CFA, CMT
Joshua Steiner, CFA