A head of tomorrow’s interest rate decision – at which we think there’s no prospect of President Mario Draghi moving from current levels – we want to give a quick update on our European economic outlook through the 9 charts below.
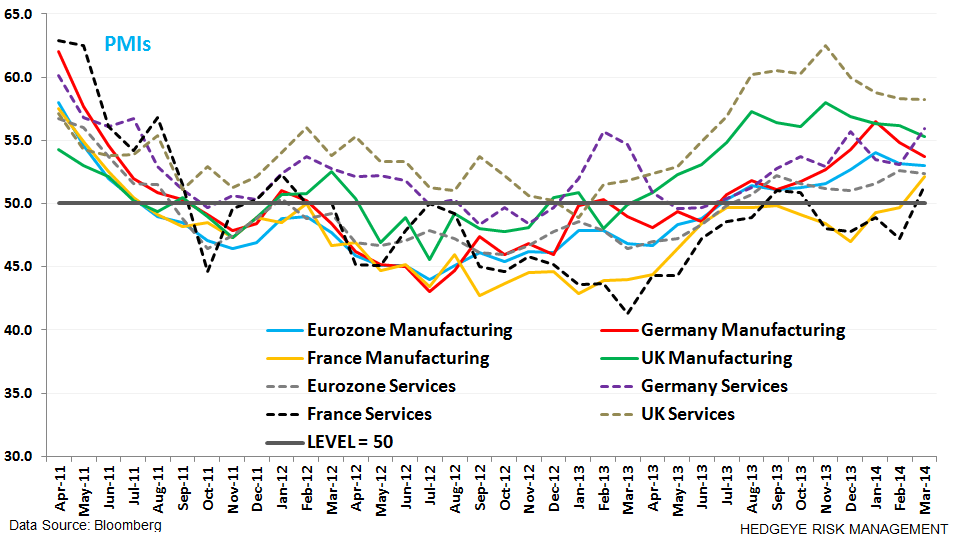
- PMIs have moderated and somewhat flat lined over recent months (the UK and Germany Manufacturing are notable callouts), however the data remains grounded above the 50 line (expansion) and in aggregate is in-line with modest growth ticking higher, and remaining stable. We continue to marginally prefer European equities over U.S. equities.
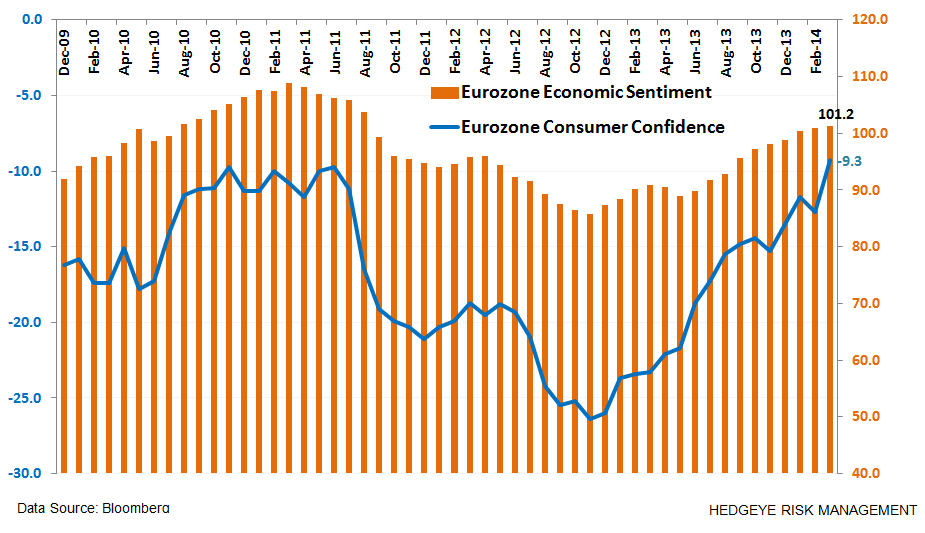
- Confidence continues to grind higher. In the next two charts we show this trend across Economic Sentiment, Consumer Confidence, and Business Confidence.

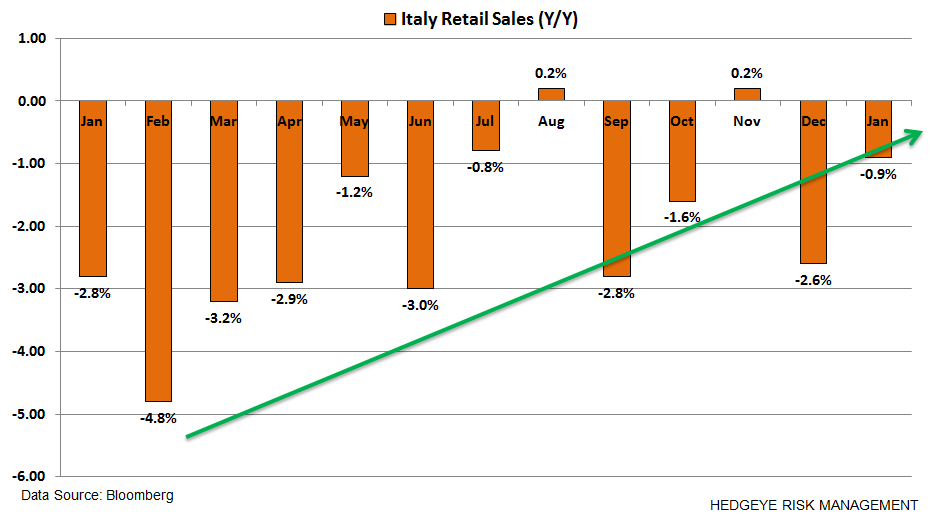
- Italian Retail Sales is one call-out to the performance of the periphery. The Italian Retail Sales data shows fits and starts of improvement, however we think the trend line will move higher to positive as we head into the back half of the year. While Italian politics remain far from stable, we expect the young new government of PM Matteo Renzi to spur confidence. The Italian stock market (FTSE MIB) is up a monster +14.8% YTD, with Greece (Athex) up +16.2% and Portugal (PSI 20) up +17.3% as the top performing European equities YTD.
- New Car Sales across Europe have shown steady improvement over the past 14 months, and have remained positive over the last 6 months. We view confidence in big ticket items, like a car, as a material read-through on the positive state of the European consumer (and there’s no distortion here from a cash-for-clunkers program).

- Inflation – we view the media’s manic deflation scares as misplaced. The ECB has long signaled to the market a very extended programs to return CPI towards its target level of 2.0%. In the second chart below we show how far CPI has moved in the last 12 months: our take-away is that deflation of the inflation is a tailwind to consumption. ECB VP Victor Constancio said yesterday that he expects a higher reading in April, versus the 0.5% reading in March.


- Germany, along the UK (via the etf EWU), has been a preferred equity position via EWG. As we show in the chart below, the DAX is comfortably trading above its TREND line of support at 9,382. The EUR/USD remains resilient, supported by stable underlying growth of the region and policy from the ECB to better shield the member states and shore up the link between the banking systems and the sovereigns. For now, the dovish Fed head Janet Yellen is supporting a strong EUR/USD (TREND support = $1.36). Strong German Factory Orders is merely one important signal that Germany’s industry export base is firing on all cylinders.


Matthew Hedrick
Associate