We use our weekly risk monitor primarily as an intermediate/longer term risk management tool. We look for early sings of inflections in bigger picture indicators so that we don't find ourselves flat-footed at times of major inflections. We try and keep the sensitivity "setting" low enough to avoid numerous false positive signals, but high enough that we don't actually miss the important signals. Anyone who's been involved in markets and risk management knows what a tricky balancing act this can be.
Along these lines, the bottom line is that there's very little being signaled on the risk front right now. Systemic interbank risk measures are all benign. Commodity price inflation, which had been a rising issue through the first ~10 weeks of the year, is now showing signs of cooling off, at least based on the CRB index price. One of the few areas of ongoing pressure is the 2-10 yield spread, which compressed a further 5 bps last week to 227 bps. In our experience, the trend in place tends to remain the path until you see the risk environment inflect. As we're not seeing any real inflection in risk at the moment, we wouldn't be surprised to see the general upward trend continue for the short/intermediate term trend.
Financial Risk Monitor Summary
• Short-term(WoW): Positive / 3 of 13 improved / 2 out of 13 worsened / 8 of 13 unchanged
• Intermediate-term(WoW): Negative / 4 of 13 improved / 5 out of 13 worsened / 4 of 13 unchanged
• Long-term(WoW): Positive / 5 of 13 improved / 2 out of 13 worsened / 6 of 13 unchanged

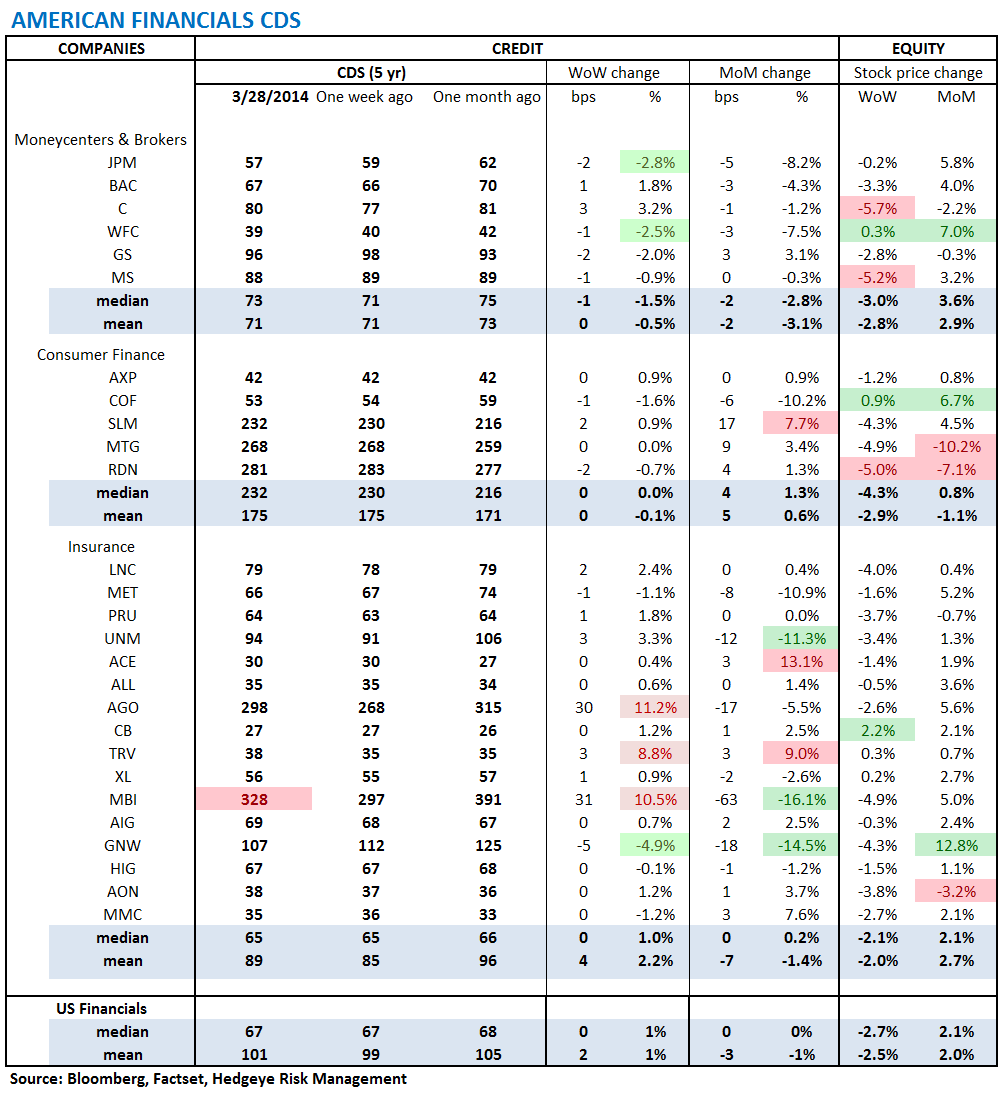
1. U.S. Financial CDS - Swaps widened for 16 out of 27 domestic financial institutions. Overall, however, the moves were generally small with the exception of the bond guarantors, MBI (+31 bps w/w) and AGO (+30 bps w/w). The global US banks were mixed with Citi the worst performer at +3 bps and JPM and GS at -2 bps.
Tightened the most WoW: GNW, JPM, WFC
Widened the most WoW: AGO, MBI, TRV
Tightened the most WoW: MBI, GNW, UNM
Widened the most MoM: ACE, TRV, SLM
2. European Financial CDS - It was another week of broad-based tightening for EU financial swaps, consistent with the falling risk associated with the Russia/Ukraine situation. Sberbank of Russia also posted another large w/w improvement (-23 bps to 318 bps).

3. Asian Financial CDS - There was substantial w/w tightening across Asian Financials last week. Indian bank swaps were tighter by 16-34 bps, while Chinese banks tightened 8-9 bps.

4. Sovereign CDS – Sovereign swaps mostly tightened over last week. Portuguese sovereign swaps tightened by -8.0% (-17 bps to 191 ) while Italian sovereign swaps widened by 0.5% (1 bps to 135).


5. High Yield (YTM) Monitor – High Yield rates fell 0.7 bps last week, ending the week at 5.70% versus 5.71% the prior week.

6. Leveraged Loan Index Monitor – The Leveraged Loan Index rose 1.0 points last week, ending at 1,855.

7. TED Spread Monitor – The TED spread rose 1 basis point last week, ending the week at 19.5 bps this week versus last week’s print of 18.49 bps.

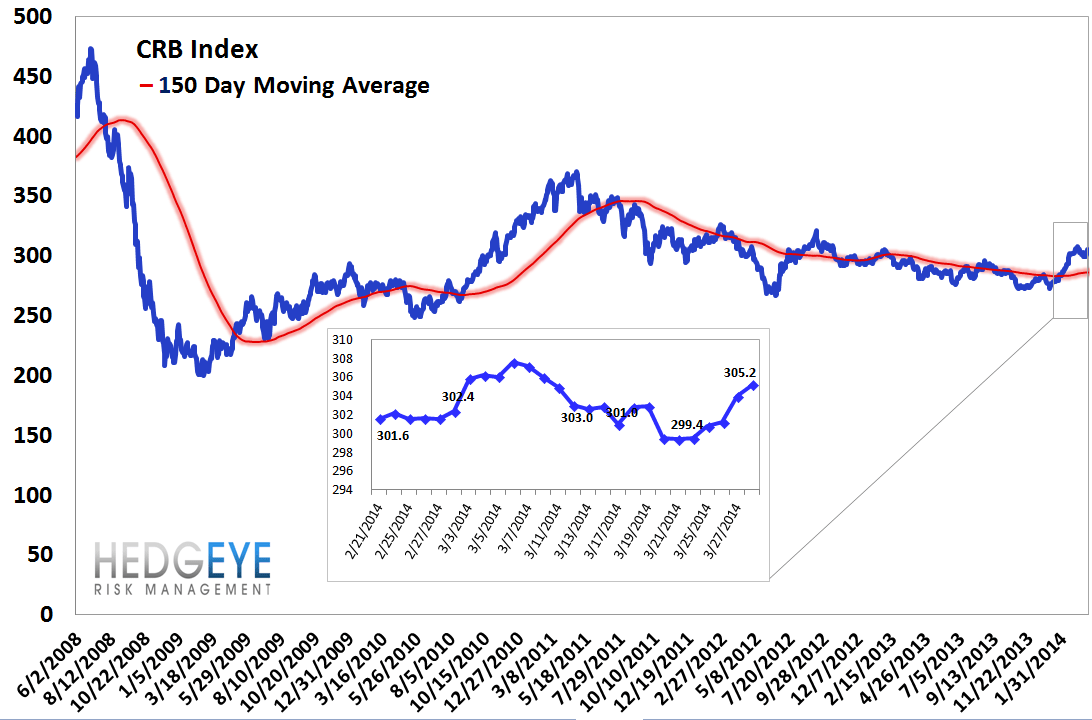
8. CRB Commodity Price Index – The CRB index rose 0.8%, ending the week at 305 versus 303 the prior week. As compared with the prior month, commodity prices have increased 1.2% We generally regard changes in commodity prices on the margin as having meaningful consumption implications.
9. Euribor-OIS Spread – The Euribor-OIS spread (the difference between the euro interbank lending rate and overnight indexed swaps) measures bank counterparty risk in the Eurozone. The OIS is analogous to the effective Fed Funds rate in the United States. Banks lending at the OIS do not swap principal, so counterparty risk in the OIS is minimal. By contrast, the Euribor rate is the rate offered for unsecured interbank lending. Thus, the spread between the two isolates counterparty risk. The Euribor-OIS spread widened by 2 bps to 15 bps.

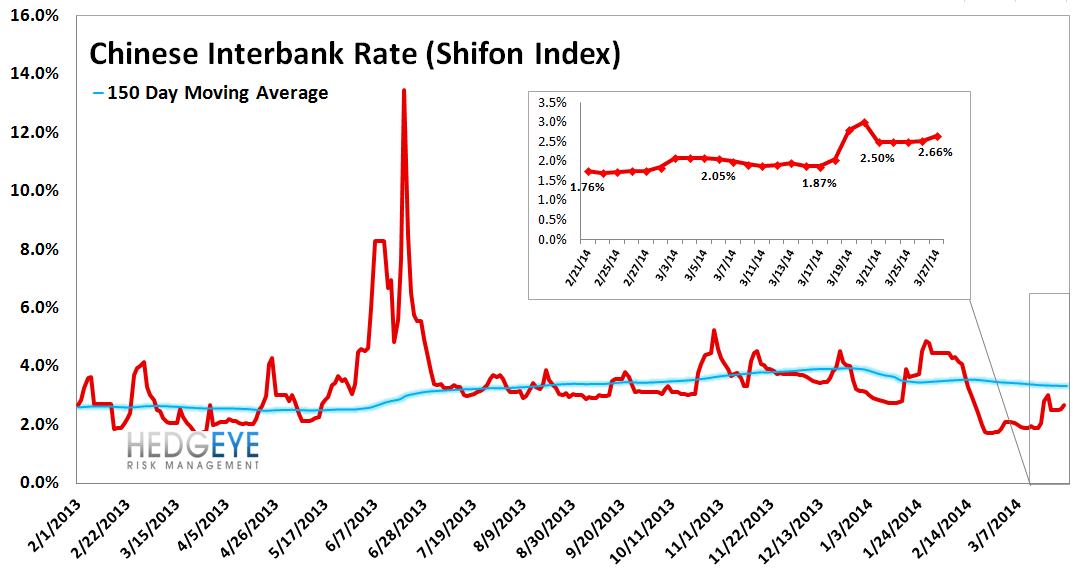
10. Chinese Interbank Rate (Shifon Index) – The Shifon Index rose 16 basis points last week, ending the week at 2.66% versus last week’s print of 2.50%. The Shifon Index measures banks’ overnight lending rates to one another, a gauge of systemic stress in the Chinese banking system.
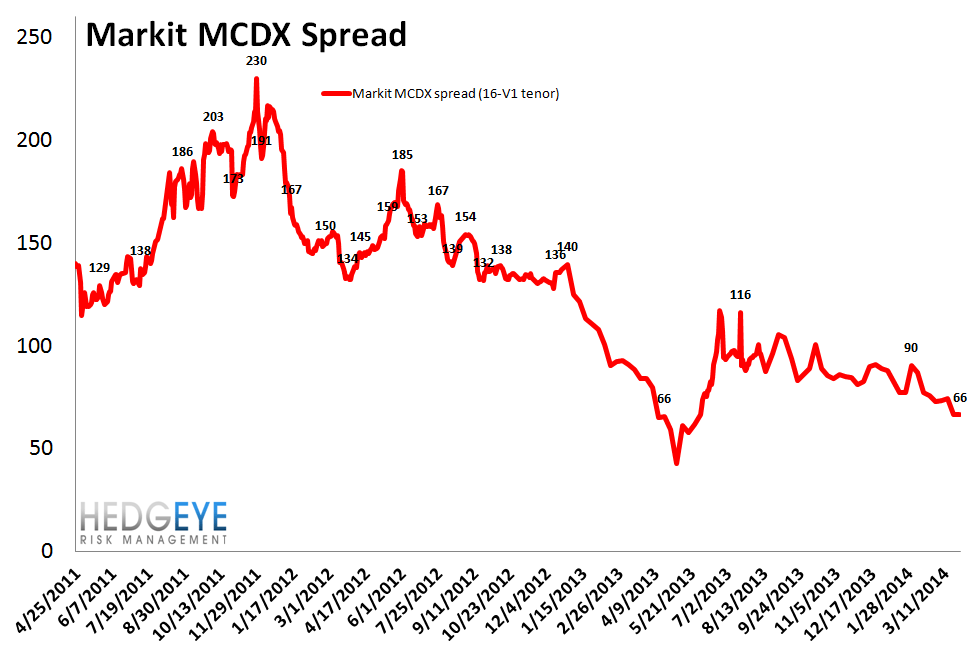
11. Markit MCDX Index Monitor – Last week spreads tightened -1 bps, ending the week at 66 bps versus 67 bps the prior week. The Markit MCDX is a measure of municipal credit default swaps. We believe this index is a useful indicator of pressure in state and local governments. Markit publishes index values daily on six 5-year tenor baskets including 50 reference entities each. Each basket includes a diversified pool of revenue and GO bonds from a broad array of states. We track the 16-V1.
12. Chinese Steel – Steel prices in China rose 0.3% last week, or 10 yuan/ton, to 3,275 yuan/ton. We use Chinese steel rebar prices to gauge Chinese construction activity, and, by extension, the health of the Chinese economy.

13. 2-10 Spread – Last week the 2-10 spread tightened to 227 bps, -5 bps tighter than a week ago. We track the 2-10 spread as an indicator of bank margin pressure.

14. XLF Macro Quantitative Setup – Our Macro team’s quantitative setup in the XLF shows 0.5% upside to TRADE resistance and 0.9% downside to TRADE support.

Joshua Steiner, CFA
Jonathan Casteleyn, CFA, CMT