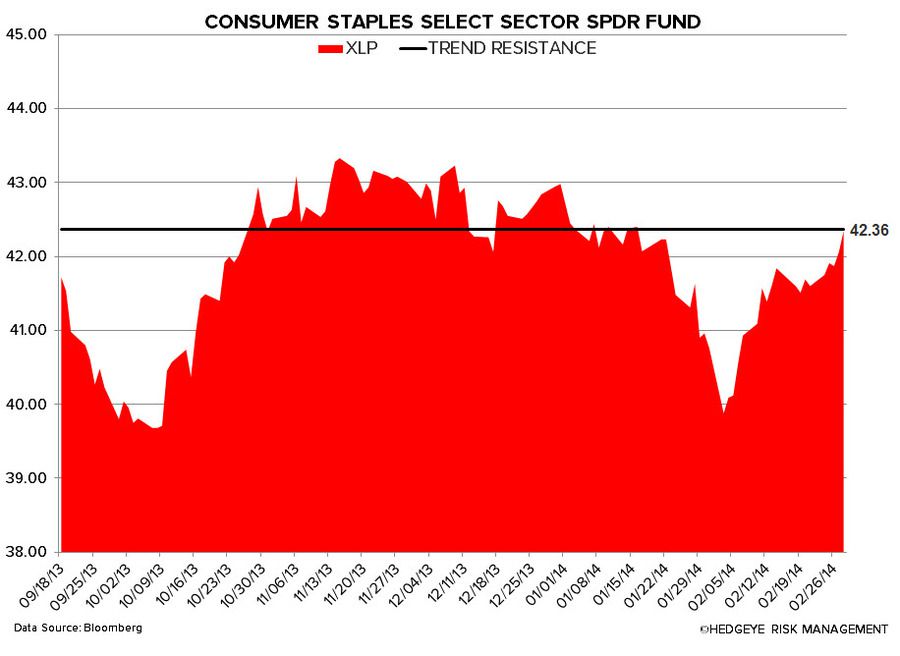
Consumer Staples remains the worst performing sector year-to-date, down -1.5%, however the sector did outperform the broader market last week, rising +1.8% versus the S&P500 at +1.3%, and for the first time all year the XLP outperformed the SPX on a week-over-week basis!
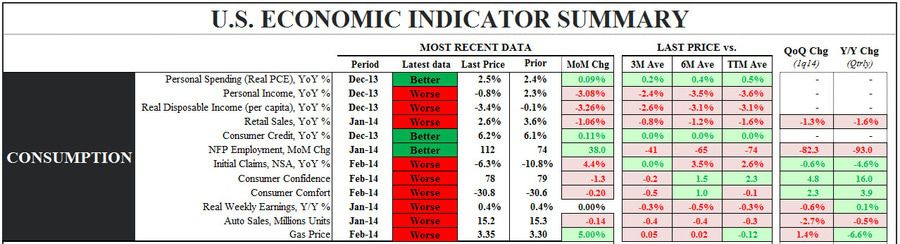
Weighing on the sector, the Hedgeye U.S. Consumption Model is flashing predominantly red, as only 3 of the 12 metrics are flashing green.
From a quantitative set-up the sector remains broken across the immediate term TRADE and intermediate term TREND durations, our language for a bearish medium term sector outlook. You’ll see a similar bearish setup for most of the largest names in Consumer Staples.
We continue to believe that the sector is facing numerous headwinds, including:
- U.S. consumption growth is slowing as inflation rises, in-line with the Macro team’s 1Q14 theme of #InflationAccelerating
- The economies and currencies of the emerging market – once the sector’s greatest growth engine – remain weak with the prospect of higher inflation in 2014 eroding real growth
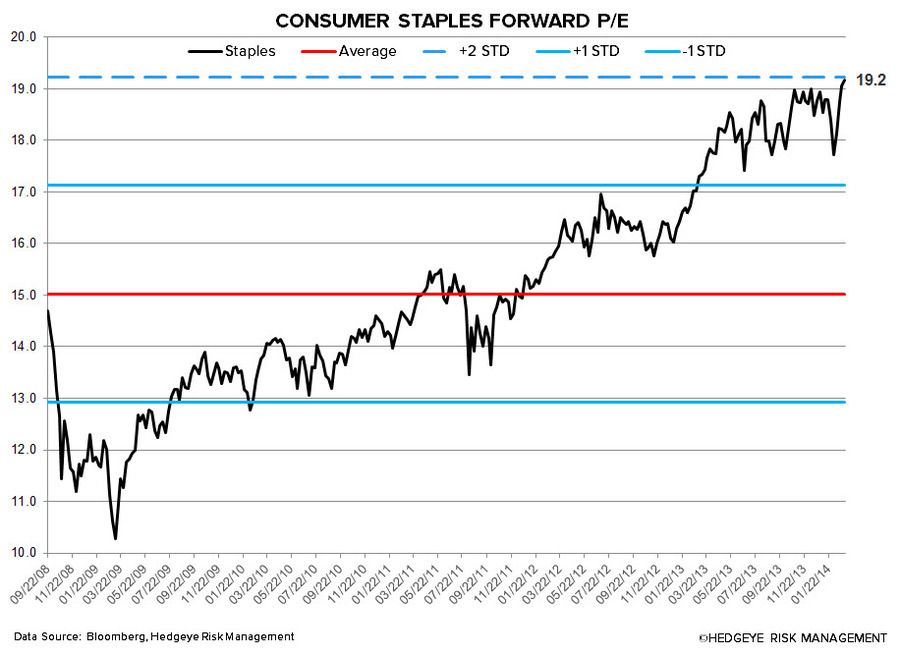
- The sector is loaded with a premium valuation (P/E of 19.2x)
- Less sector Yield Chasing as Fed continues its tapering program
- The high frequency Bloomberg weekly U.S. Consumer Comfort Index has not seen any real improvement over the past 6 months, but expanded to -28.6 versus -30.6 in the prior week

Top 5 Week-over-Week Divergent Performances:
Positive Divergence: SAFM +5.7%; NUS +4.3%; SAM +3.4%; HSH +2.8%; CHD +2.8%
Negative Divergence: HSY -1.7%; CPB -1.5%; MNST -1.1%; ABI -1%; FLO -0.9%
Last Week’s Research Notes
Earnings Calls This Week (in EST):
Monday (3/3): NUS 11am
Tuesday (3/4): -
Wednesday (3/5): BF/B 10am
Thursday (3/6): -
Friday (3/7): -
Matt Hedrick
Food, Beverage, Tobacco, and Alcohol
Howard Penney
Household Products
(o)
Quantitative Setup
In the charts below we look at the largest companies by market cap in the Consumer Staples space from both a quantitative perspective and fundamental aspect where we can offer one. As you will see over time, sometimes our fundamental view does not align with the quantitative setup (though not often).
BUD – market beta can be a marvelous thing (until it goes bearish again); BUD rallies back above its TREND line (barely) of $103.52

DEO – unlike BUD, DEO tried to recapture $127.29 TREND support but failed

KO – bearish TREND firmly intact up at $39.97; one of the better looking big cap shorts on my quant screens

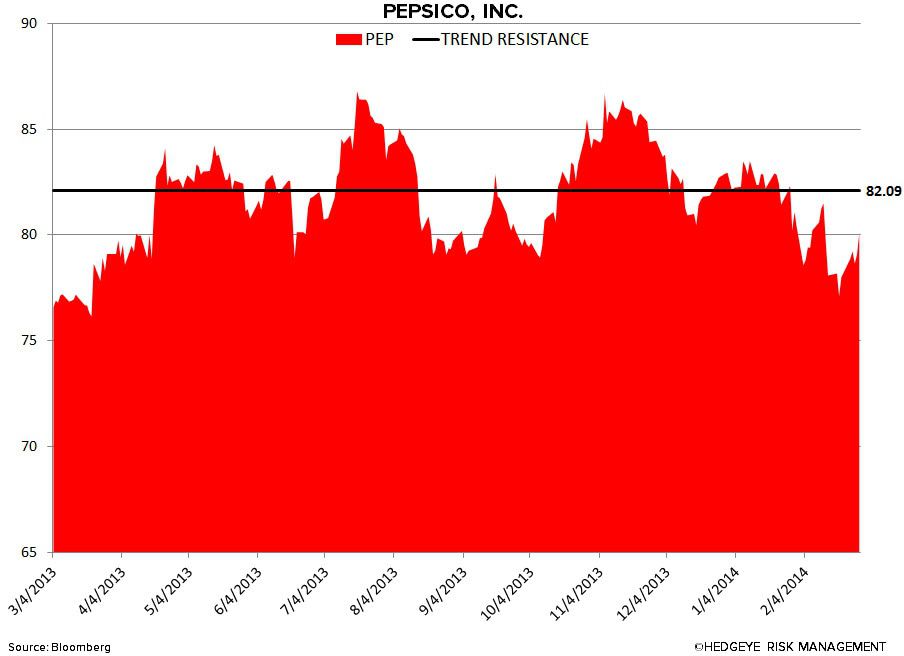
PEP – doesn’t look worse than KO, but it still looks bad – bearish TREND resistance intact up at $82.09
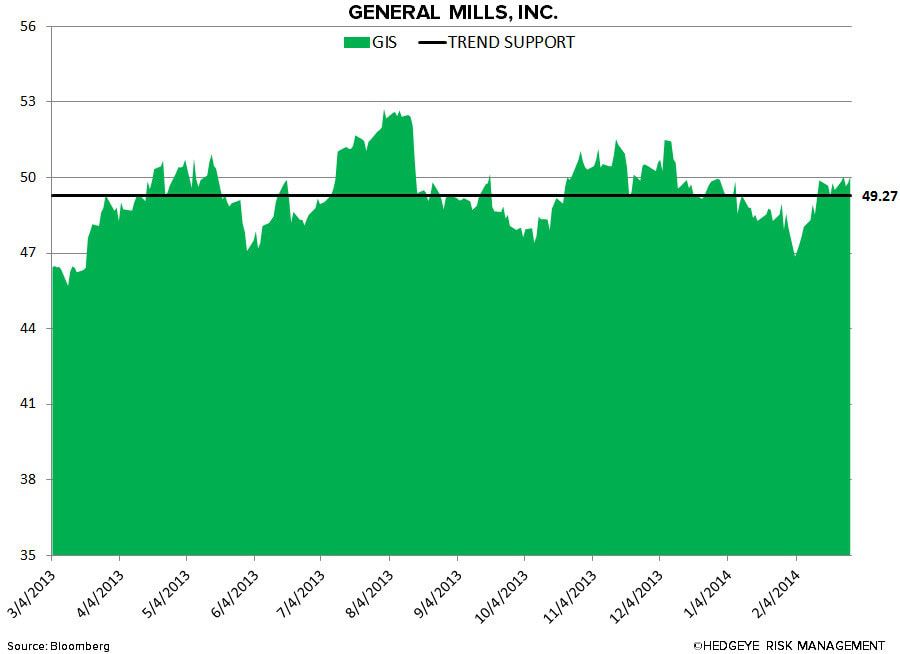
GIS – bearish to bullish reversal had some confirmation signals last week; watching TREND support of $49.27 closely
MDLZ – trying hard to recover its year-end markup momentum, but having some issues; needs to hold TREND support of 33.39 to remain bullish in our model

KMB – still the best looking long on our list; bullish TREND support intact with an immediate-term TRADE risk range to manage of 107.23-110.93 for now

PG – in spite of the market’s v-bottom beta bounce in FEB, Procter remains broken with TREND resistance overhead at 80.19

MO – despite last week’s ramp (on no volume), Altria remains bearish TREND @Hedgeye w/ resistance = $37.11

PM – still one of the ugliest quantitative setups in all of big cap consumer; TREND resistance remains overhead at 83.46

