SUMMARY
We have been mulling over what to do with WTW shares, wondering if there was anymore downside left in the short after selling off almost 30% since its earnings release.
After further analysis, it appears WTW is now considerably overvalued, which implies that the street is baking in upside to 2014 guidance or a return to revenue growth in 2015. We do not believe either is likely; particularly the latter (see our most recent notes and slide deck below for more detail).
So even if the company can surprise to the upside in 2014, we doubt the stock will move much higher in response. On the other hand, if WTW fundamentals deteriorate further, it could trade much lower; especially as we draw closer to 2015 when the secular themes become more evident.
02/14/14 12:09 PM EST
01/30/14 11:00 AM EST
01/22/14 09:21 AM EST
PEAK MULTIPLES SUGGEST NO ROOM FOR ERROR
WTW is now trading near its peak LTM valuation on both a NTM P/E and NTM EV/EBITDA basis (both on an absolute and relative basis). That statement seems counter intuitive given the considerable miss on 2014 guidance.
Prior to its 2014 guidance release, consensus was expecting 2014 EPS of $2.77. WTW issued 2014 EPS guidance of $1.30-$1.60, missing EPS guidance by 48% at the midpoint. However, the stock is down ~29% since its earnings release; resulting in a considerable divergence on P/E basis (the "E" declined more than the "P"). Net-net, WTW's trading multiples have expanded considerably since the 2014 guidance release
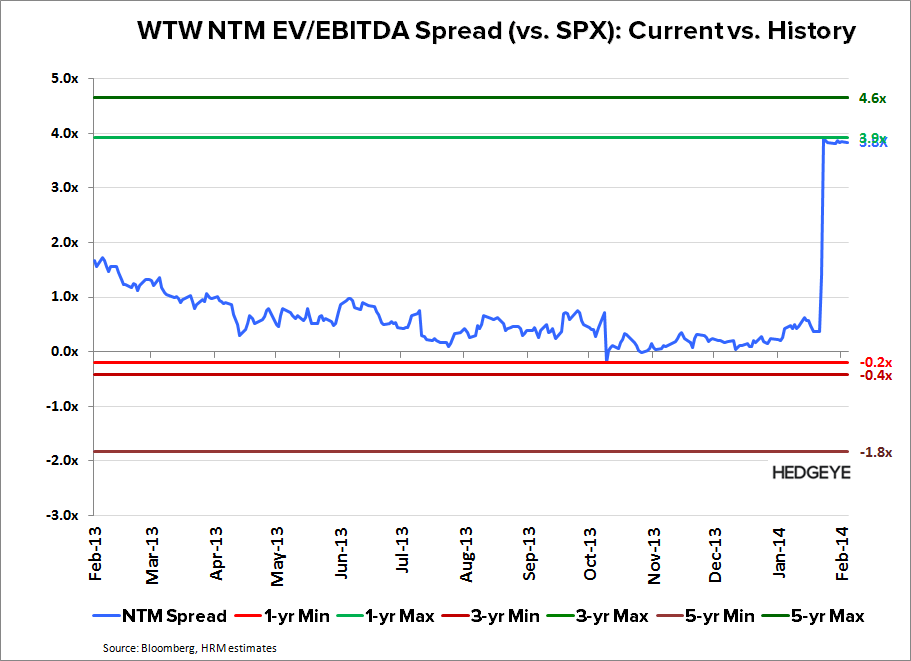
In the charts below, we're showing a time series of WTW's valuations relative to its historical peak and trough ranges over the past 1,3, and 5 years. The first chart is WTW's NTM P/E and NTM EV/EBITDA valuations on an absolute basis; the multiples have expanded roughly 5x and 4x turns, respectively, since its earnings release.


The same dynamic holds on a relative basis (vs. the SPX). In the charts below, we are showing a similar time series of the spread between WTW's multiples vs. those of the SPX (in order to remove the impact of beta from WTW's valuation). The relative valuations have expanded as well, which implies that the street believes WTW should be trading inline with the SPX on a NTM P/E basis, and 4x above on a NTM EV/EBITDA basis.

Hesham Shaaban, CFA
@HedgeyeInternet
Thomas W. Tobin
@HedgeyeHC