Singapore contracts in Q4. Here is the growth and market share breakdown.
Market trends
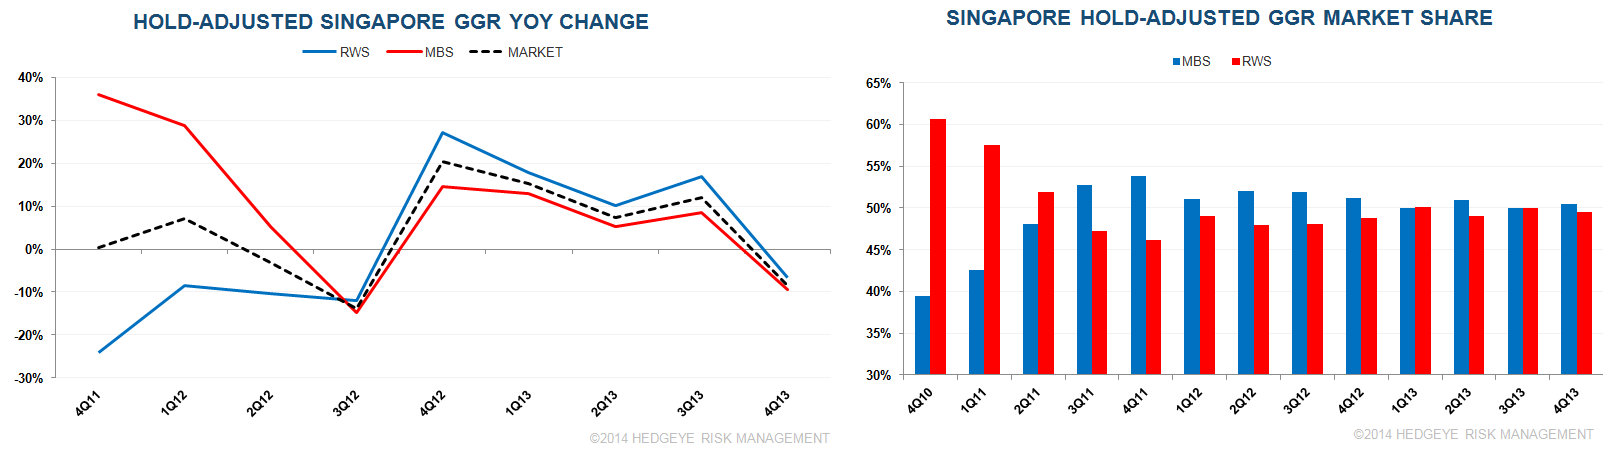
- Singapore gross gaming revenues declined 12% YoY in Q4 2013 to S$1.7 BN. Adjusting for hold (based on average since inception of 2.80%) for both periods, GGR still slumped 9% YoY.
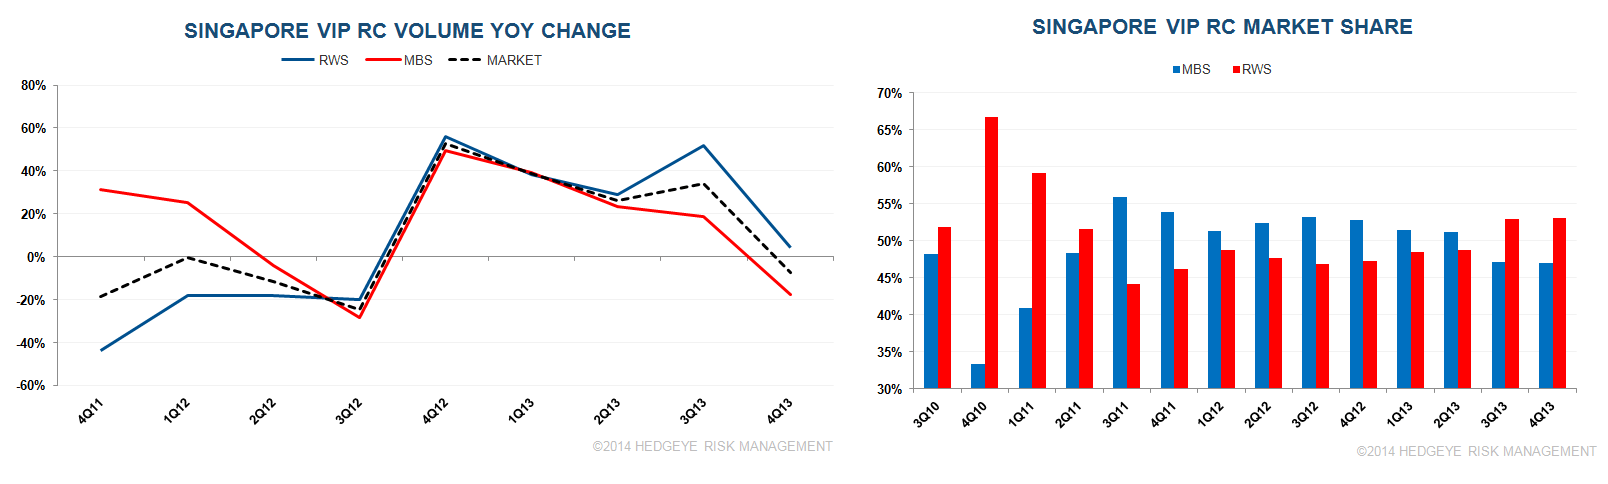
- Market VIP rolling chip volume shrank 7% YoY in 4Q, snapping 4 quarters of high double digit gains
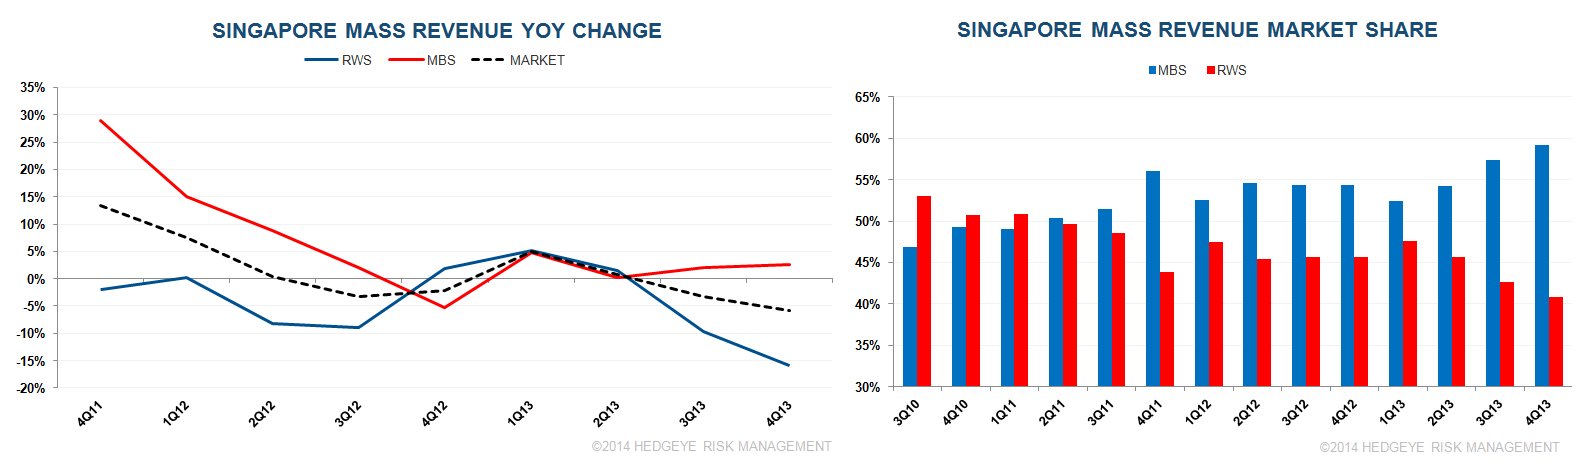
- Mass revenue fell again in Q4, -6% YoY, the 2nd consecutive quarterly decline
- Net non-gaming revenue fell 8% YoY in Q4, the 1st decline since 3Q 2012
Market shares
- MBS GGR share is in-line with the 3 year average but below recent trends
- Volume share was consistent in Q4 relative to Q3 with MBS holding 47% of VIP rolling chip share and 57% of mass table volume share
- MBS's mass table revenue share rose 2% points sequentially to 59% due to higher mass hold and volumes
- MBS's slot revenue share was unchanged sequentially in Q4
* Blue trend lines in the charts below are from MBS's perspective