Investment Company Institute Mutual Fund Data and ETF Money Flow:
In the most recent week, both equity vehicles including mutual funds and ETFs produced higher net inflows than commensurate fixed income products.
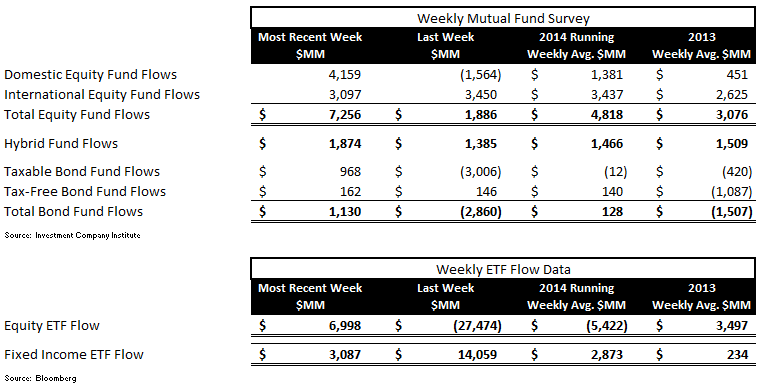
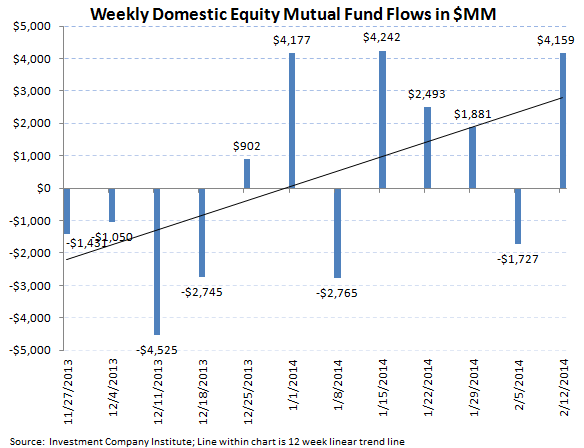
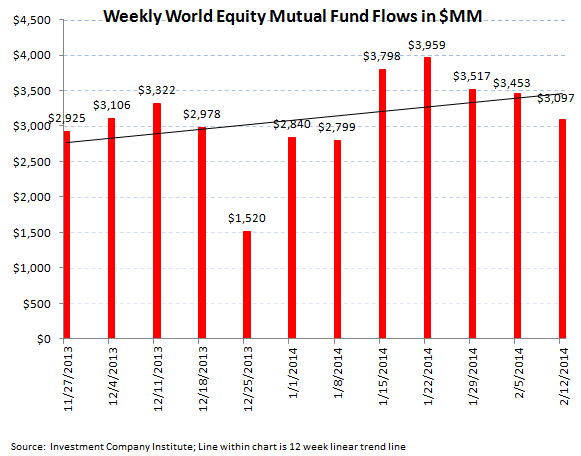
Total equity mutual funds produced a strong week of inflow with $7.2 billion of net subscriptions, an acceleration from the $1.8 billion inflow the week prior. The $7.2 billion inflow was balanced during the most recent 5 day period, with $4.1 billion flowing into domestic equity funds and $3.1 billion flowing into international stock funds. The 2014 running weekly average inflow for equity mutual funds is now $4.8 billion, an improvement from the $3.0 billion weekly average inflow for 2013.
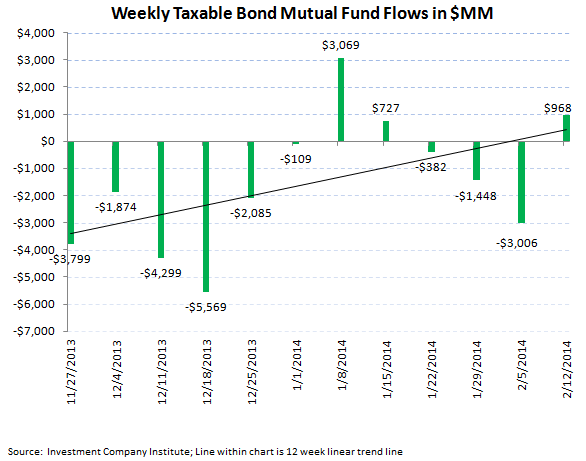
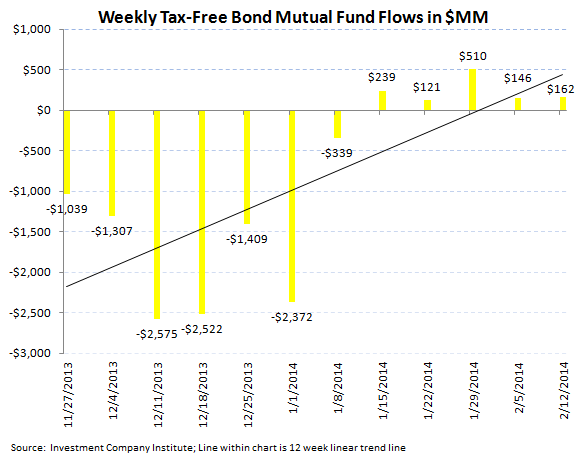
Fixed income mutual funds also had net inflows during the 5 day period ending February 12th with $1.1 billion flowing into all fixed income funds. The breakout of the slight inflow amounted to $968 million into taxable products and a $162 million inflow into tax-free or municipal products, the 5th consecutive week of inflow into munis after 33 consecutive weeks of outflow. The 2014 weekly average for fixed income mutual funds now stands at a slight $128 million weekly inflow, an improvement from 2013's weekly average outflow of $1.5 billion but a far cry from the $5.8 billion weekly average inflow from 2012 (our view of the blow off top in bond fund inflow).
ETFs, across the board, had a strong week of subscriptions with stock ETFs drawing in $6.9 billion in net inflow with bond ETFs taking in $3.0 billion in net new money. This was an improvement on the stock side this week after a record all time withdrawal in equity ETFs the week prior of $27.4 billion. The bond inflow this week of $3.0 billion decelerated from the record all-time inflow the week prior of $14.0 billion. The 2014 weekly averages are now a $5.4 billion weekly outflow for equity ETFs and a $2.8 billion weekly inflow for fixed income ETFs.
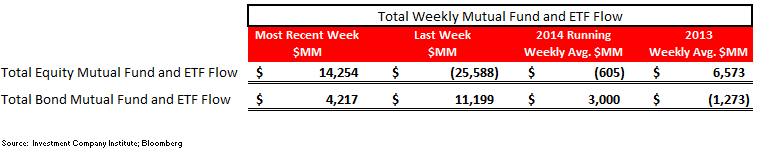
The net of total equity mutual fund and ETF trends against total bond mutual fund and ETF flows totaled a positive $10.0 billion spread for the week ($14.2 billion of total equity inflow versus the $4.2 billion inflow within fixed income; positive numbers imply inflows for stocks; negative numbers imply inflows for bonds). The 52 week moving average has been $6.6 billion (positive spread to equities), with a 52 week high of $30.9 billion (positive spread to equities) and a 52 week low of -$36.9 billion (negative numbers imply a net inflow into bonds for the week).
Continued strong equity mutual fund inflow trends currently support our favorite long idea in the sector, T Rowe Price (TROW) which should benefit with a leading retail equity mutual fund franchise.
Mutual fund flow data is collected weekly from the Investment Company Institute (ICI) and represents a survey representing 95% of the investment management industry's mutual fund assets. This data largely represents the actions of retail investors. Exchange traded fund (ETF) information is extracted from Bloomberg and is matched to the same weekly reporting schedule as the ICI data. According to industry leader Blackrock (BLK), U.S. ETF participation is 60% institutional investors and 40% retail investors.
Most Recent 12 Week Flow in Millions by Mutual Fund Product:
Most Recent 12 Week Flow Within Equity and Fixed Income Exchange Traded Funds:


Net Results:
The net of total equity mutual fund and ETF trends against total bond mutual fund and ETF flows totaled a positive $10.0 billion spread for the week ($14.2 billion of total equity inflow versus the $4.2 billion inflow within fixed income; positive numbers imply inflows for stocks; negative numbers imply inflows for bonds). The 52 week moving average has been $6.6 billion (positive spread to equities), with a 52 week high of $30.9 billion (positive spread to equities) and a 52 week low of -$36.9 billion (negative numbers imply a net inflow into bonds for the week).

Continued strong equity mutual fund inflow trends currently support our favorite long idea in the sector, T Rowe Price (TROW) which should benefit with a leading retail equity mutual fund franchise.


Jonathan Casteleyn, CFA, CMT
Joshua Steiner, CFA
