Editor's note: This research note was originally published February 13, 2014 at 08:13 in Financials. For more information on how you can subscribe to Hedgeye click here.
Investment Company Institute Mutual Fund Data and ETF Money Flow

In the most recent week, we saw a continuation of the tale of two tapes with equity inflow and fixed income outflow in mutual funds (retail) and a record reallocation within more institutionally based ETFs with record outflows in stock ETFs and record inflows into bond ETFs.
Total equity mutual funds experienced another week of inflow as the lagged effect of fund flow chasing performance from last year has been strong enough to offset near term worries about emerging markets. For the week ending February 5th, equity mutual funds had $1.8 billion of inflow, a deceleration from the $5.4 billion inflow the week prior but none-the-less a positive inflow in a tough macro news flow week. The $1.8 billion subscription for the week however was below the running year-to-date weekly average inflow of $4.3 billion for stock funds in 2014.
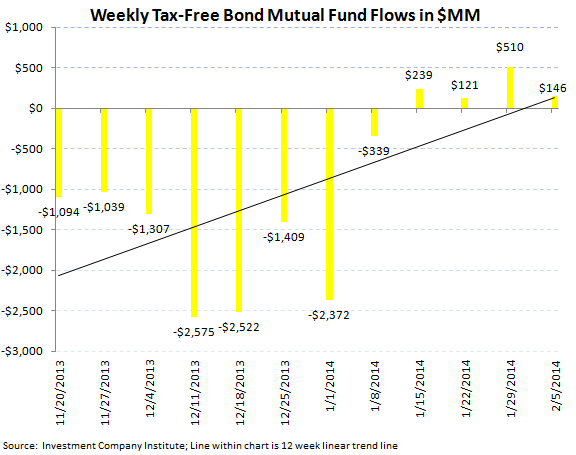
Fixed income mutual funds conversely had net outflows during the most recent 5 day period, a continuation from the negative performance of 2013. In the week ending February 5th, total fixed income mutual funds experienced a $2.8 billion outflow, which broke out into a $3.0 billion redemption in taxable bonds and a $146 million inflow into tax-free bonds, the fourth straight week of inflow for munis. The 2014 weekly average for fixed income mutual funds now stands at a $75 million weekly outflow, an improvement from 2013's weekly average outflow of $1.5 billion but a far cry from the $5.8 billion weekly average inflow from 2012 (our view of the blow off top in the bond market).
ETFs, a more institutionally oriented product, reflected the nascent risks in emerging markets and weaker U.S. economic data with record outflows in stock ETFs and conversely record inflows in fixed income ETFs. Stock ETFs lost a weekly record $27.4 billion in the 5 day period ending February 5th, the biggest weekly outflow in our data set spanning 18 months of information. Bond ETFs conversely booked the biggest weekly inflow in our information from Bloomberg putting up a $14 billion subscription. The 2014 weekly averages considering this latest data are now a $7.9 billion weekly outflow for equity ETFs and a $2.8 billion weekly inflow for fixed income ETFs.
The net of total equity mutual fund and ETF trends against total bond mutual fund and ETF flows totaled a negative $36.7 billion spread for the week (-$25.5 billion of total equity outflows versus the $11.1 billion inflow within fixed income; positive numbers imply inflows for stocks; negative numbers imply inflows for bonds). The 52 week moving average has been $6.5 billion (positive spread to equities), with a 52 week high of $30.9 billion (positive spread to equities) with this week setting the 52 week low of equity/debt weekly spread of -$36.7 billion (negative numbers imply a net inflow into bonds for the week).
While the short term fund flow picture is showing drastic volatility with this week's historic outflow in ETFs, we highlight that the longer term picture within the mutual fund market continues to relay a rebound in stock funds to the detriment of fixed income funds. Looking at top line gross sales of all equity funds on a monthly basis, shows the continued trajectory higher to new record highs since 2007 through the end of last year. According to ICI data, all equity funds grossed $159 billion in sales in December 2013, a new high in all available data from 2007. Conversely, fixed income mutual funds continue to book lower highs in sales after peaking in early 2013. The most recent sales tallies in December (as January 2014 totals aren't available yet) amounted to $92 billion, well off the all-time high of $118 billion in fixed income monthly sales in January 2013. While net flows (what the industry normally focuses on) can be volatile on a short term basis, top line sales totals will eventually wash out short-term inflow or outflow and hence are a better indicator of which products have the most momentum. Thus these top-line sales trends still relay incrementally stronger demand for equities over fixed income in mutual funds for now.

Most Recent 12 Week Flow in Millions by Mutual Fund Product:


Most Recent 12 Week Flow Within Equity and Fixed Income Exchange Traded Funds:


Net Results:
The net of total equity mutual fund and ETF trends against total bond mutual fund and ETF flows totaled a negative $36.7 billion spread for the week (-$25.5 billion of total equity outflows versus the $11.1 billion inflow within fixed income; positive numbers imply inflows for stocks; negative numbers imply inflows for bonds). The 52 week moving average has been $6.5 billion (positive spread to equities), with a 52 week high of $30.9 billion (positive spread to equities) with this week setting the 52 week low of equity/debt weekly spread of -$36.7 billion (negative numbers imply a net inflow into bonds for the week).

While the short term fund flow picture is showing drastic volatility with this week's historic outflow in ETFs, we highlight that the longer term picture within the mutual fund market continues to relay a rebound in stock funds to the detriment of fixed income funds. Looking at top line gross sales of all equity funds on a monthly basis, shows the continued trajectory higher to new record highs since 2007 through the end of last year. According to ICI data, all equity funds grossed $159 billion in sales in December 2013, a new high in all available data from 2007. Conversely, fixed income mutual funds continue to book lower highs in sales after peaking in early 2013. The most recent sales tallies in December (as January 2014 totals aren't available yet) amounted to $92 billion, well off the all-time high of $118 billion in fixed income monthly sales in January 2013. While net flows (what the industry normally focuses on) can be volatile on a short term basis, top line sales totals will eventually wash out short-term inflow or outflow and hence are a better indicator of which products have the most momentum. Thus these top-line sales trends still relay incrementally stronger demand for equities over fixed income in mutual funds for now.


Jonathan Casteleyn, CFA, CMT
203-562-6500
Joshua Steiner, CFA
203-562-6500