A sub-title in our analysis of the weekly Initial Jobless Claims data yesterday was: #Deceleration: Par for the 2014 Course. HERE
And since I feel like I’ve written the same note highlighting the deceleration in the rate of improvement in the domestic, fundamental macro data about 20X to start 2014, it felt fitting to just recycle that Title also.
INDUSTRIAL DECELERATION: That industrial production slowed in January isn’t particularly surprising given the soft ISM data and the slowing sales and rising inventory of auto’s - See yesterday’s note for more detail PANGLOSSIAN PIQUE: JANUARY RETAIL SALES
Consumer Durables, led by the 5% decline in vehicle production, was the biggest loser but Non-Durables, Business Equipment and Industrial Supply all decelerated on both a MoM and YoY basis. Capacity Utilization slipped to 78.5% in January, with the -0.4% MoM decline the largest since August of 2012.
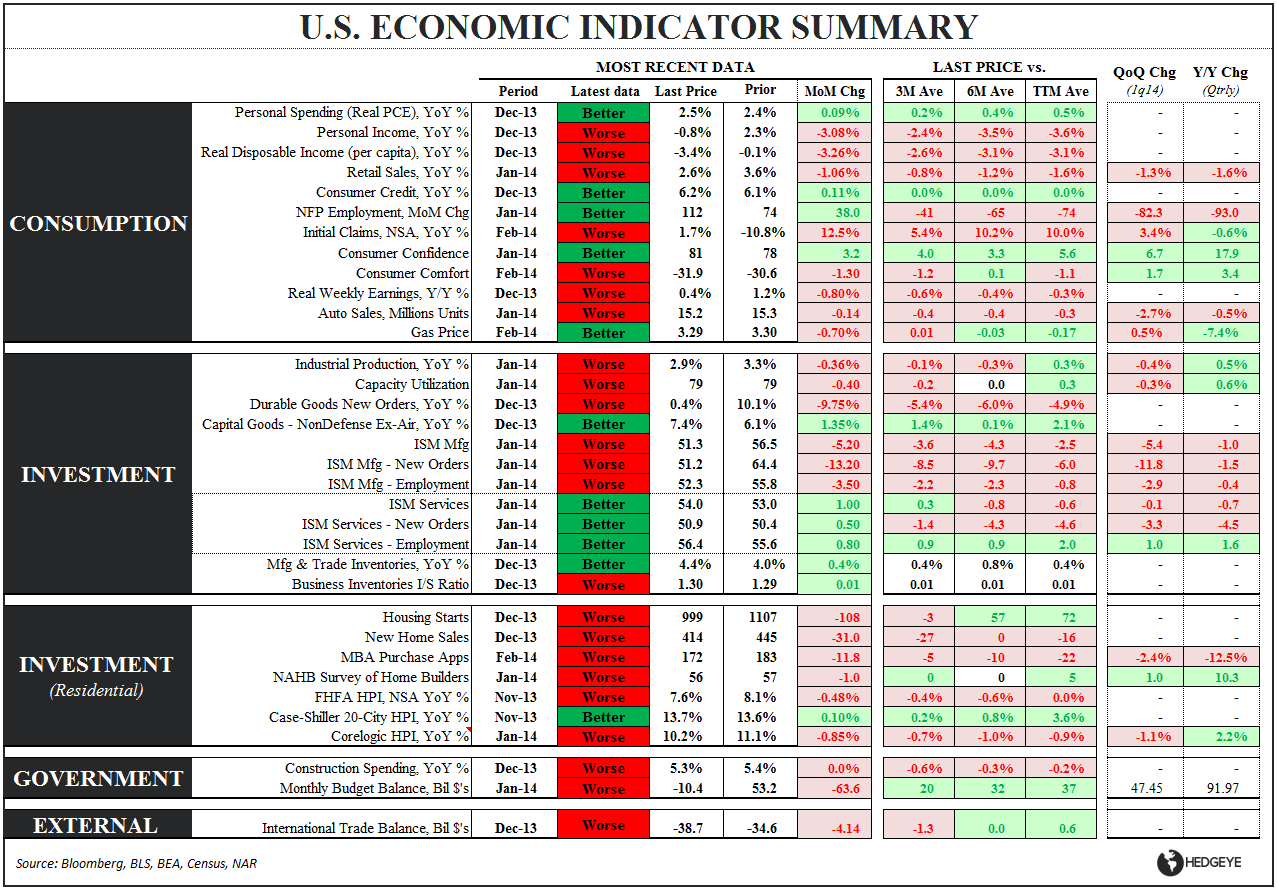
MAPPING THE SLOWDOWN: We detail IP and Capacity Utilization data specifically in the table below but, with most of the significant data points for January now in, it’s probably more worthwhile to provide a summary refresh on the prevailing slope of improvement across the preponderance of the fundamental macro series.
Perhaps the most efficient way to get a feel for the broader trend in the slope of growth is just to look at the Economic Summary Table (below) and simply observe if there is more ‘more red’ or ‘more green’ staring back at you.
As can be seen, the sequential rate of improvement across most of the latest higher frequency data is “Worse”.
Looking a little closer, even the data currently flagged as “Better” is less than inspiring.
Let’s take a quick tour of each of the “Better’s” in turn:
- NFP: NFP employment improved sequentially in January but that’s only because December was a brick. Employment gains are decelerating vs the 3M/6M/12M averages.
- Consumer Confidence: The data here has been middling and largely equivocal to start 2014. The Conference Board measure improved in December, the preliminary Univ. of Michigan number for Feb was unchanged vs. January, and Bloomberg’s Weekly measure is tracking below the January average thus far in February.
- ISM Services: ISM services improved in January but that was really only because it completely tanked in December as New Orders saw its largest sequential decline since 1980.
- Case-Shiller HPI: Media pundits still (for whatever reason) love monitoring and citing the Case-Shiller home price data. The fact is that the Case-Shiller HPI is one of the most lagging housing measures there is. The “better” reading in the table below is actually a November number and we already have preliminary January Corelogic data – Home price growth as measured by Corelogic has been decelerating for 3 consecutive months.
- Inventories: It’s a bit of a toss-up on whether to classify accelerating inventory growth as a positive or negative. From a strict GDP accounting perspective, rising inventories can be a positive for reported growth. However, when end demand is slowing and inventories are rising, the other side of that inventory build drags on both corporate profitability and reported economic growth.
So, on the back of the decelerations reported in Job Openings (JOLTS), Mortgage Purchase Applications, Retail Sales, and Initial Claims earlier in the week, Industrial Production and Capacity Utilization in January both deteriorated.
I haven’t checked but I’ll bet the dollar is down, gold is outperforming and #hashtags lamenting the distortive impacts of the weather are still in crescendo – yep, par for the 2014 ……
Happy Valentines Day. Enjoy the long weekend


Christian B. Drake
c
@HedgeyeUSA
