Editor's note: This complimentary, unlocked research note was originally published February 06, 2014 at 08:05 in Financials by Hedgeye Financials analyst Jonathan Casteleyn. For more information on how you can subscribe to our products click here.

Investment Company Institute Mutual Fund Data and ETF Money Flow:
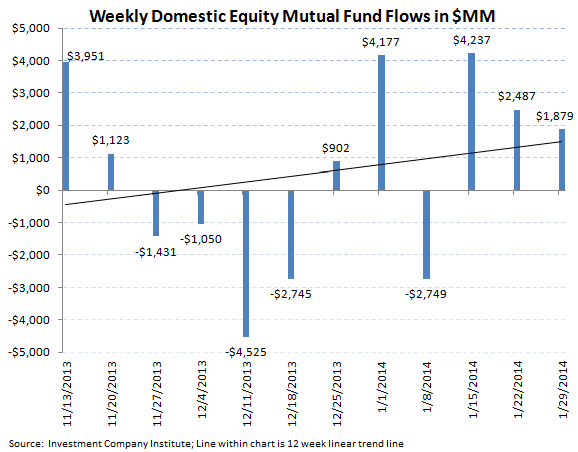
Total equity mutual funds experienced another week of inflow as the lagged effect of fund flow chasing performance from last year has been strong enough to offset near term worries about emerging markets. Within the total equity fund result, domestic equity mutual funds had $1.8 billion of inflow in the most recent 5 day period, just ahead of the 2014 weekly average for domestic funds of $1.4 billion in inflow. International equity funds netted more than domestic funds posting a $3.5 billion inflow. This most recent result coupled with the strong result from the week prior has now moved the 2014 weekly average for total equity mutual funds to a $4.9 billion inflow average to start 2014, a continuation on 2013's positive trends where $3.0 billion per week on average flowed into total stock funds.
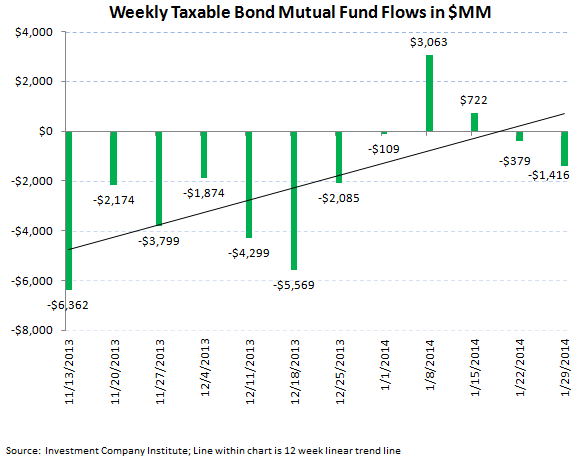
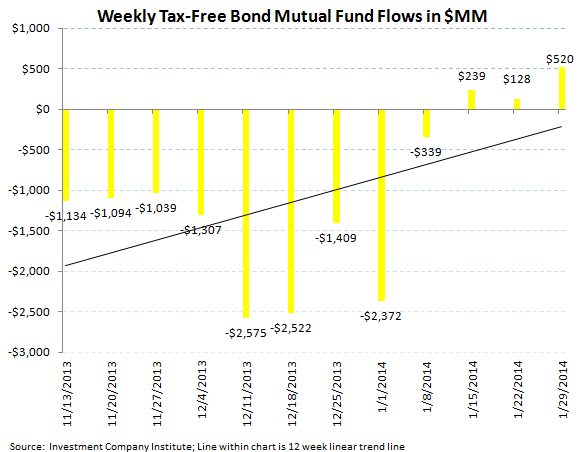
Fixed income mutual funds had continued net outflows during the most recent week, a continuation from the negative performance of 2013. In the week ending January 29th, total fixed income mutual funds experienced a $896 million outflow, which broke out into a $1.4 billion redemption in taxable bonds and a $520 million inflow into tax-free bonds, the third straight week of inflow for munis. The 2014 weekly average for fixed income mutual funds now stands at a $635 million weekly inflow, an improvement from 2013's weekly average outflow of $1.5 billion but a far cry from the $5.8 billion weekly average inflow from 2012 (our view of the blow off top in the bond market).
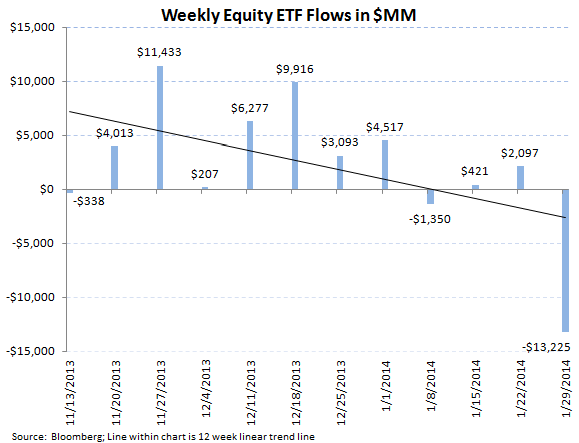
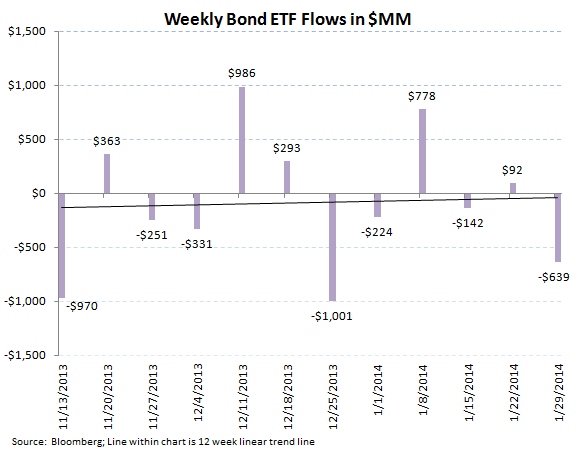
ETFs, a more institutional product, reflected the nascent risks in emerging markets and slightly weaker U.S. economic data with a massive outflow in stock ETFs and a slight redemption in fixed income ETFs. Stock ETFs lost a substantial $13.2 billion in the 5 day period ending January 29th, the biggest weekly outflow in our data set spanning 18 months of information, with bond ETFs experiencing a $639 million redemption. The 2014 weekly averages considering this latest data are now a $3.0 billion weekly outflow for equity ETFs and a $22 million weekly inflow for fixed income ETFs.
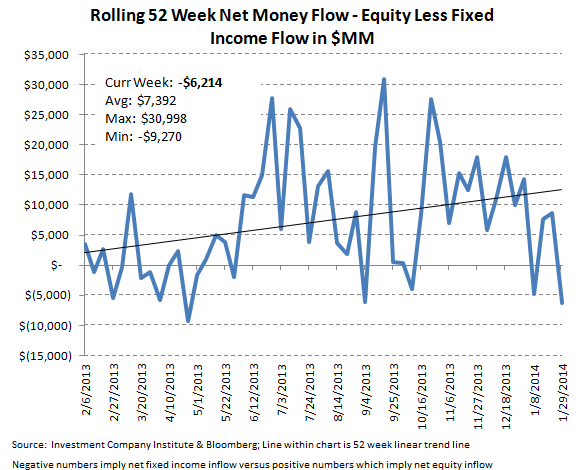
The net of total equity mutual fund and ETF trends against total bond mutual fund and ETF flows totaled a negative $6.2 billion spread for the week (-$7.7 billion of total equity outflows versus the -$1.5 billion outflow within fixed income; positive numbers imply inflows for stocks; negative numbers imply inflows for bonds). The 52 week moving average has been $7.3 billion (positive spread to equities), with a 52 week high of $30.9 billion (positive spread to equities) and a 52 week low of equity/debt weekly spread of -$9.2 billion (negative numbers imply a net inflow into bonds for the week).
In last week's ICI report, we outlined the historical relationship between retail mutual fund flows and market performance. In analyzing 12 years worth of data, our research shows that fund flow chases or lags performance by 6 months for equities and 9 months for fixed income (the best fit line between these two variables). Thus the strong return for stocks in 2013 of 30% in the S&P 500 and the first loss in the Barclay's Aggregate bond index in 14 years is still driving the direction of retail fund flows currently (see late week's report here).


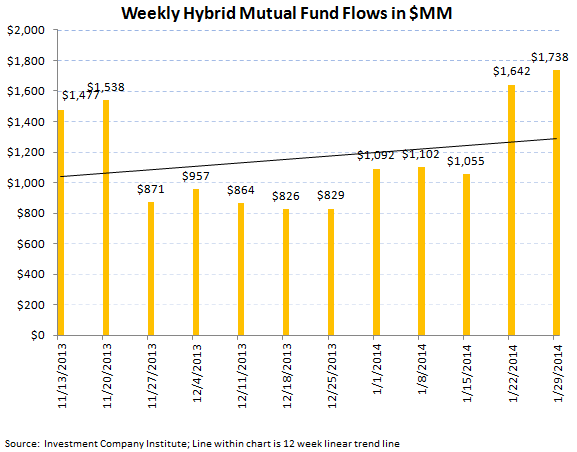
Most Recent 12 Week Flow in Millions by Mutual Fund Product:

Most Recent 12 Week Flow Within Equity and Fixed Income Exchange Traded Funds:
Net Results:
The net of total equity mutual fund and ETF trends against total bond mutual fund and ETF flows totaled a negative $6.2 billion spread for the week (-$7.7 billion of total equity outflows versus the -$1.5 billion outflow within fixed income; positive numbers imply inflows for stocks; negative numbers imply inflows for bonds). The 52 week moving average has been $7.3 billion (positive spread to equities), with a 52 week high of $30.9 billion (positive spread to equities) and a 52 week low of equity/debt weekly spread of -$9.2 billion (negative numbers imply a net inflow into bonds for the week).
Jonathan Casteleyn, CFA, CMT
203-562-6500
Joshua Steiner, CFA
203-562-6500
