BEAT-MISS: At the midpoint mark for 4Q13 earnings, Sales & EPS Beat-Miss spreads are expanding verses 3Q13 (53%/74%) and TTM (54%/73%) averages as 65% and 79% of SPX constituent companies have beaten Sales and Earnings estimates, respectively.
Of course, the canonical means to beating estimates, particularly over the last four years, has been to progressively deflate expectations ahead of the quarter to the extent that what would have been disappointing-to-inline results ultimately gets stamped with the “Beat” label.
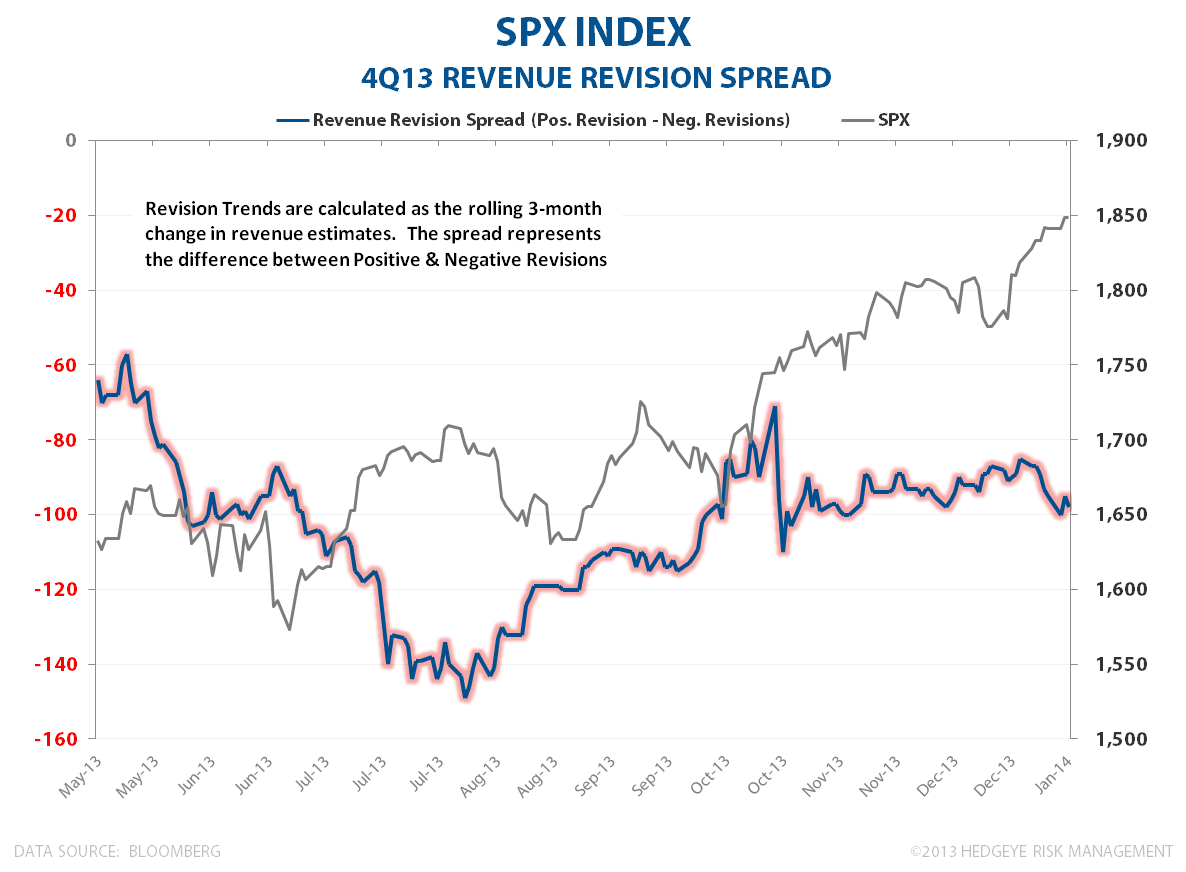
This quarter has not been an exception as topline estimates for 4Q13 have drifted steadily lower for SPX constituents over 2H13.

STYLE FACTOR PERFORMANCE: Reported results vs expectations have been fairly even across style factors with the exception of High Beta & Low Short Interest equities which have performed meaningfully better vs. prevailing topline estimates than their inverses.

FUNDAMENTAL PERFORMANCE TRENDS: Mean Reversion downside from peak corporate profitability remains the most apparant, ongoing, fundamental risk for corporate equities. Peak, of course, can getter “peak-ier” if commodity/input costs are deflating and wage inflation remains somewhere south of topline growth.
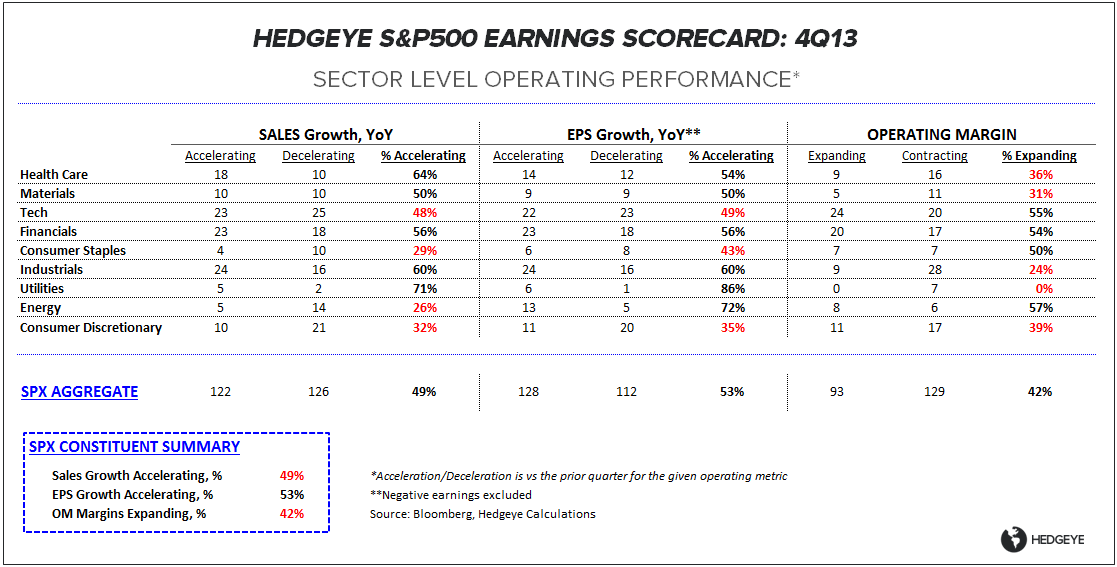
Despite the positive Beat-Miss trends, operating performance has not been particularly inspiring with 49% and 53% of companies registering sequential acceleration in sales and earnings growth, respectively. Margin performance has been similarly unimpressive with only 42% of companies reporting sequential operating margin expansion according to bloomberg data.
From a sector perspective, Financials, Industrials and Healthcare have led operating performance while Consumer Discretionary, Staples, and Tech have been the relative, fundamental laggards.
BETA or BEAT-MISS? Relative to 3Q13 where Macro completely monopolized price action, "The Print" has had a moderately impactful influence on subsequent price performance thus far in 4Q. Below we chart company Beats & Misses vs subsequent market adjusted 3-day performance.
- Sales: 59% of companies that beat sales estimates subsequently outperformed the market to the tune of 4.5% on average. The other 41% of companies that beat sales estimates underperformed the market over the subsequent 3-days by an average of -3.3%. Subsequent performance for companies missing Sales estimates was similarly mixed.
- EPS: Earnings performance has shown a stronger relationship with performance as 62% of companies beating EPS estimates subsequently outperformed the market by 4.1% on average while 38% went on to underperform the market by an average of -3.0%. EPS misses have been sold heavily with 78% of companies missing EPS estimates subsequently underperformed the market by -5.4% on average.


Enjoy Super Bowl Weekend.
Christian B. Drake
c
@HedgeyeUSA
