Summary: On a short-term basis, we see improvement and decline in roughly equal measures, while over the intermediate term there remains the trend is clearly toward improvement by a ratio of two to one. The same can be said for the long-term, where improvement is outstripping decline by a ratio of four to one.
Financial Risk Monitor Summary
• Short-term(WoW): Negative / 3 of 13 improved / 3 out of 13 worsened / 7 of 13 unchanged
• Intermediate-term(WoW): Positive / 8 of 13 improved / 4 out of 13 worsened / 1 of 13 unchanged
• Long-term(WoW): Positive / 4 of 13 improved / 1 out of 13 worsened / 8 of 13 unchanged

1. U.S. Financial CDS - The week saw big improvement in mortgage insurers MTG and RDN, furthering their m/m trend of improvement. The big banks were modestly tighter, on average, continuing their trend over the past month as well.
Tightened the most WoW: MTG, RDN, AGO
Widened the most WoW: WFC, MET, CB
Tightened the most WoW: AON, MBI, AGO
Widened the most/ tightened the least MoM: AXP, WFC, XL

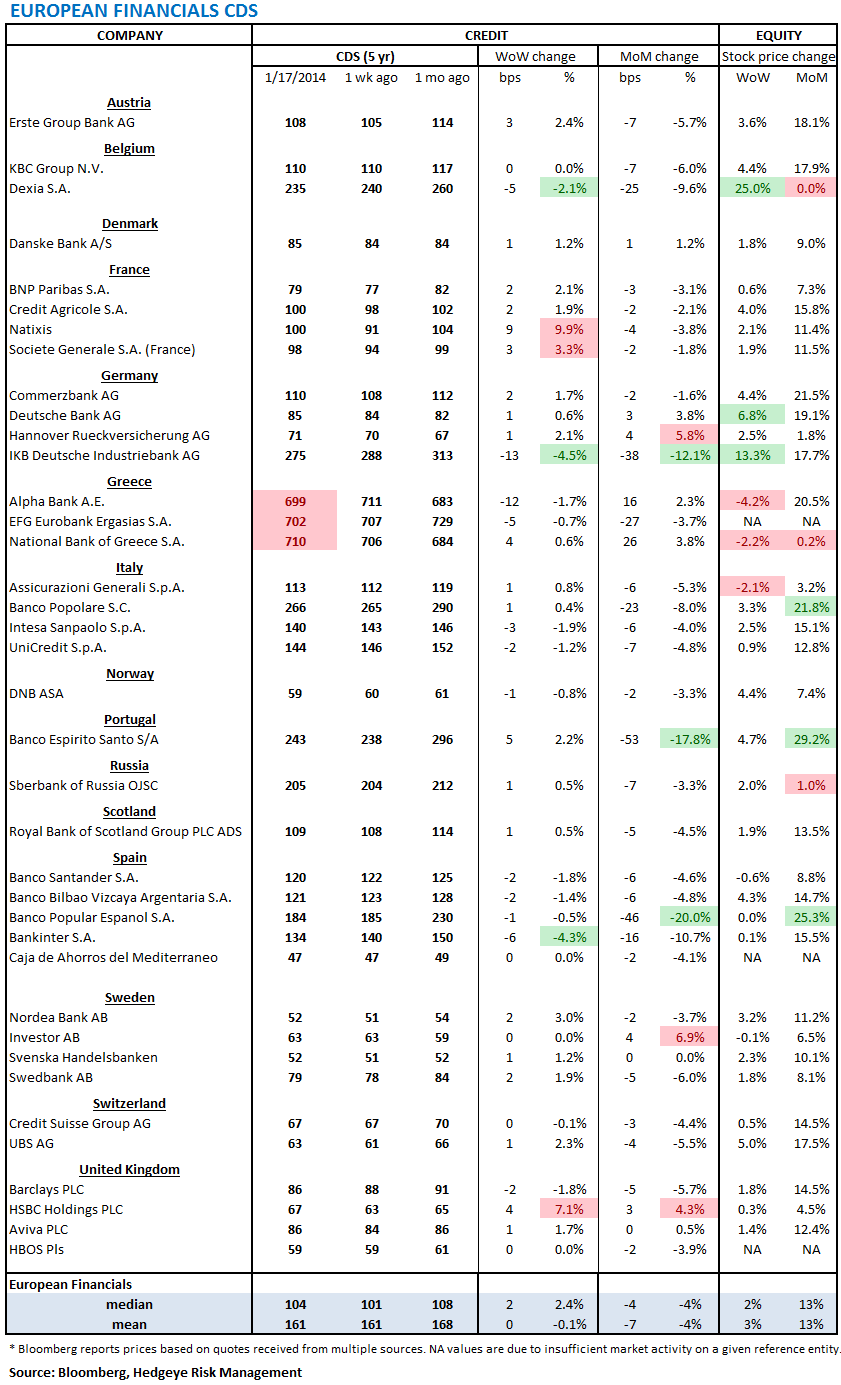
2. European Financial CDS - The most recent week saw swaps widen nominally in Europe's banking system, but the bigger takeaway remains the still-substantial tightening on a m/m basis.
3. Asian Financial CDS - Indian banks continue their see-saw trend of late, this time tightening by 11-22 bps w/w. Meanwhile, on a m/m basis the Chinese banks continue to widen, rising by 24-28 bps. Japanese banks are mixed, though, on balance, unchanged on a m/m basis.

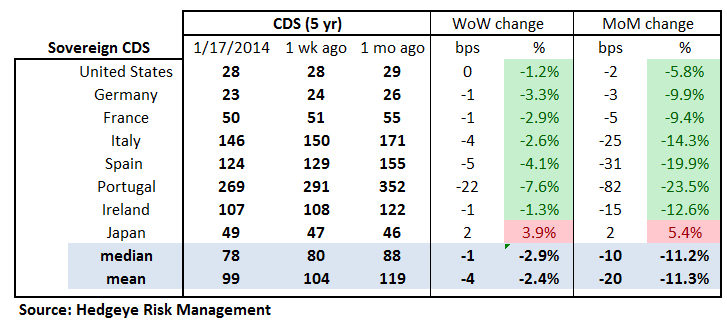
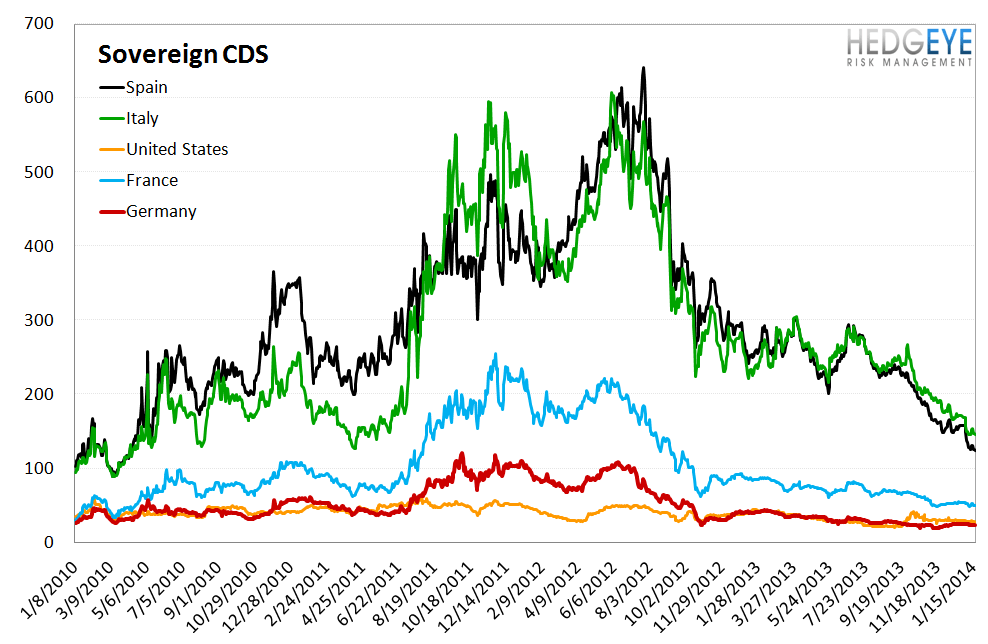
4. Sovereign CDS – Sovereign swaps mostly tightened last week with the exception of Japan where they rose 2 bps. Portuguese sovereign swaps tightened by -7.6% (-22 bps to 269 ) and U.S. sovereign swaps were unchanged. Overall, the trend of ongoing improvement in European sovereign risk profiles continues.

5. High Yield (YTM) Monitor – High Yield rates fell 8.3 bps last week, ending the week at 5.83% versus 5.91% the prior week.

6. Leveraged Loan Index Monitor – The Leveraged Loan Index rose 3.0 points last week, ending at 1850.

7. TED Spread Monitor – The TED spread was unchanged last week at 20.4 bps.

8. CRB Commodity Price Index – The CRB index rose 1.3%, ending the week at 278 versus 275 the prior week. As compared with the prior month, commodity prices have decreased -1.1% We generally regard changes in commodity prices on the margin as having meaningful consumption implications.

9. Euribor-OIS Spread – The Euribor-OIS spread was essentially unchanged at 12 bps last week. Euribor-OIS spread (the difference between the euro interbank lending rate and overnight indexed swaps) measures bank counterparty risk in the Eurozone. The OIS is analogous to the effective Fed Funds rate in the United States. Banks lending at the OIS do not swap principal, so counterparty risk in the OIS is minimal. By contrast, the Euribor rate is the rate offered for unsecured interbank lending. Thus, the spread between the two isolates counterparty risk.

10. Chinese Interbank Rate (Shifon Index) – The Shifon Index rose 1 basis point last week, ending the week at 2.77% versus last week’s print of 2.76%. The Shifon Index measures banks’ overnight lending rates to one another, a gauge of systemic stress in the Chinese banking system.

11. Markit MCDX Index Monitor – Last week spreads tightened -6 bps, ending the week at 77 bps versus 83 bps the prior week. The Markit MCDX is a measure of municipal credit default swaps. We believe this index is a useful indicator of pressure in state and local governments. Markit publishes index values daily on six 5-year tenor baskets including 50 reference entities each. Each basket includes a diversified pool of revenue and GO bonds from a broad array of states. We track the 16-V1.

12. Chinese Steel – Steel prices in China fell 0.8% last week, or 27 yuan/ton, to 3,419 yuan/ton. We use Chinese steel rebar prices to gauge Chinese construction activity, and, by extension, the health of the Chinese economy.

13. 2-10 Spread – Last week the 2-10 spread tightened to 245 bps, -4 bps tighter than a week ago. We track the 2-10 spread as an indicator of bank margin pressure.

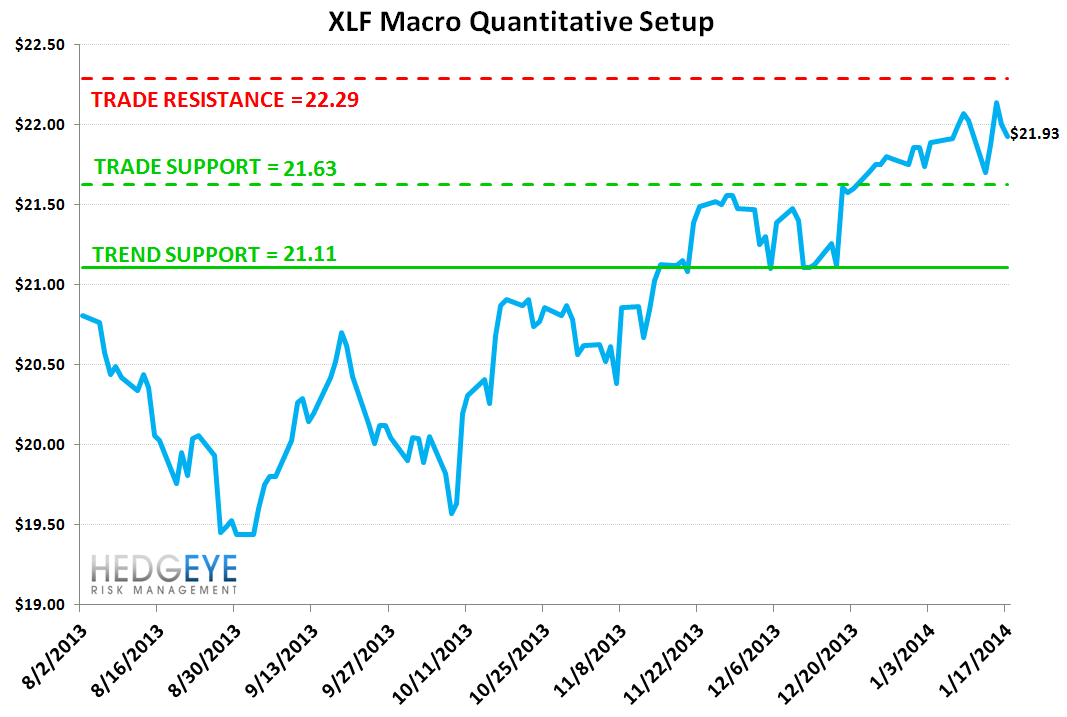
14. XLF Macro Quantitative Setup – Our Macro team’s quantitative setup in the XLF shows 1.6% upside to TRADE resistance and 1.4% downside to TRADE support.
Joshua Steiner, CFA
Jonathan Casteleyn, CFA, CMT
