2013 in Review
With all but one week of 2013 now in the books the labor data is showing a non-seasonally adjusted year-over-year improvement of 8.2% on a full-year basis. For comparison, 2012 was better by 8.1% versus 2011. This morning's data point showed a 9.0% improvement y/y while the rolling 4-wk average is better by 10.2%. By most accounts the labor data remains strong and shows ongoing improvement. Last week we had flagged a speed bump in the data, but this morning's numbers suggest that a speed bump may have been all that it was.
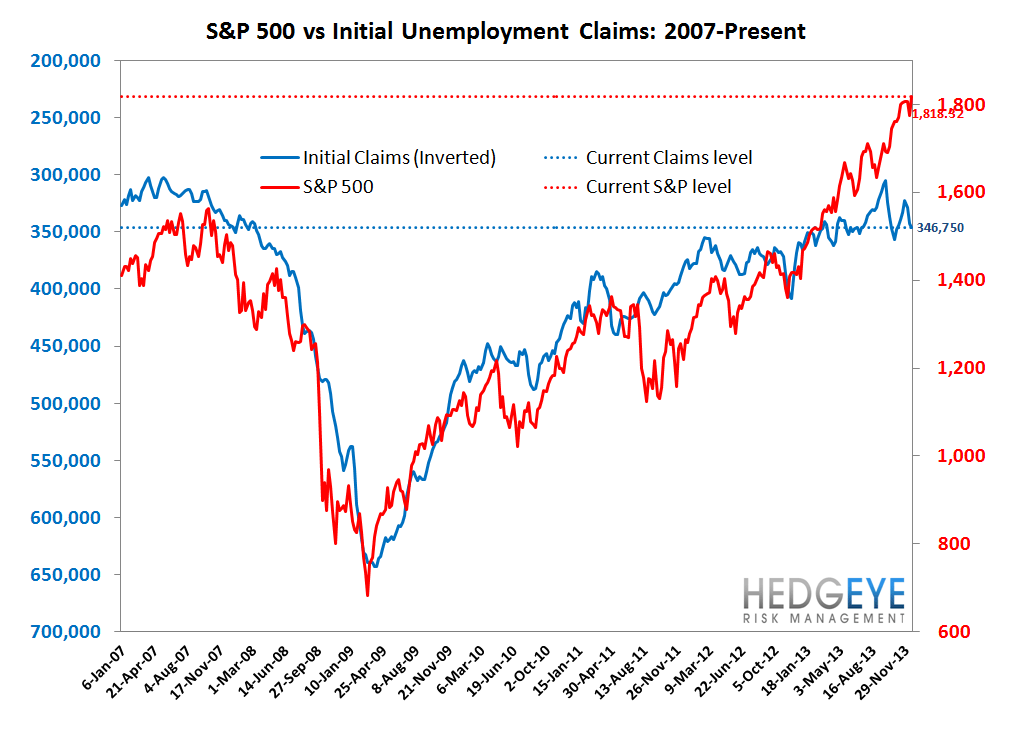
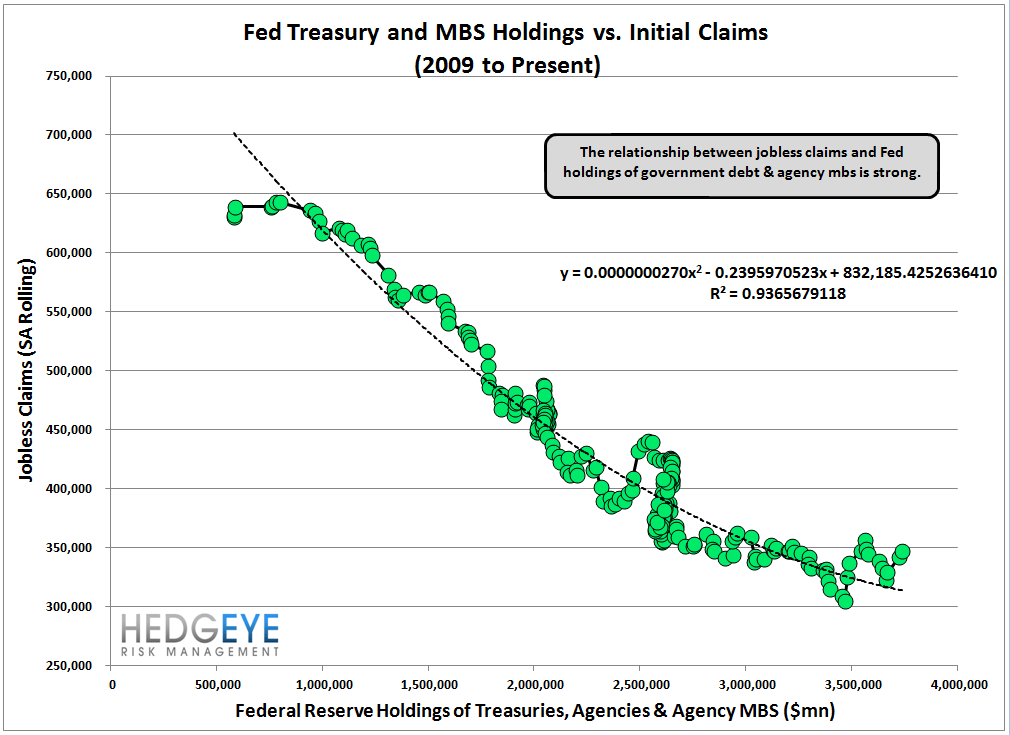
We continue to expect that the strengthening labor market data will exert ongoing upward pressure on long-term rates. This morning the 10-year treasury yield is at 2.99%, just one basis point away from its September 5 high. We've demonstrated how bank stocks are very positively correlated to 10-year yields while homebuilders are very negatively correlated. For more on that, see our publication from 11/22/13 entitled #Rates-Rising: A Current Look at Rate Sensitivity Across Financials.
The Data
Prior to revision, initial jobless claims fell 41k to 338k from 379k WoW, as the prior week's number was revised up by 1k to 380k.
The headline (unrevised) number shows claims were lower by 42k WoW. Meanwhile, the 4-week rolling average of seasonally-adjusted claims rose 4.25k WoW to 346.75k.
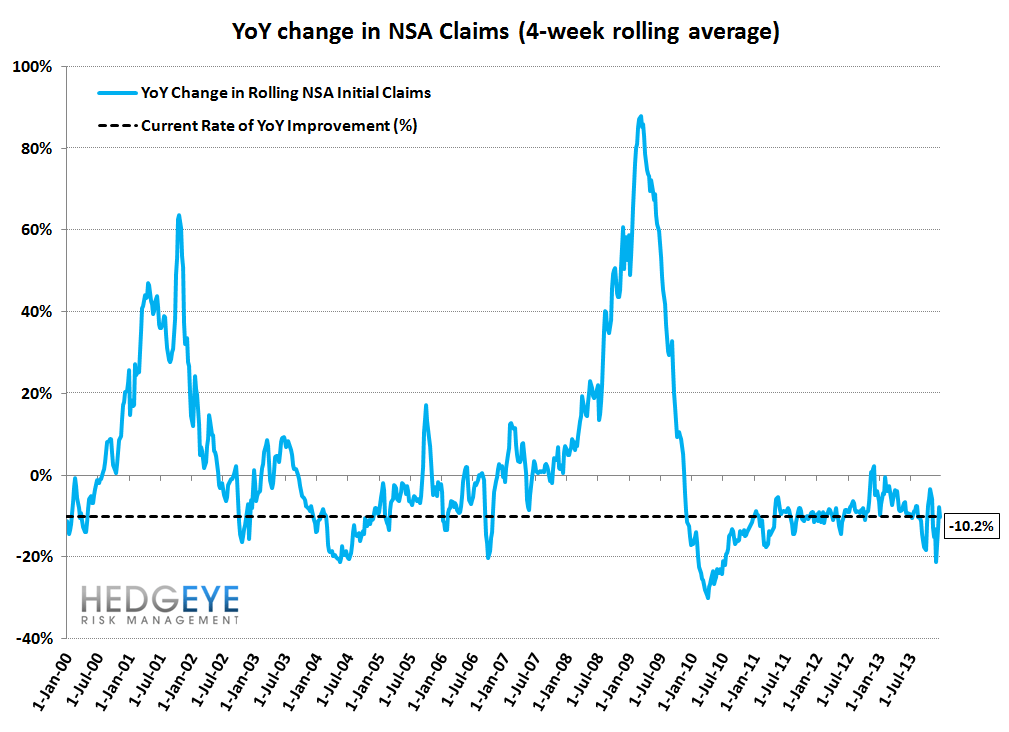
The 4-week rolling average of NSA claims, which we consider a more accurate representation of the underlying labor market trend, was -10.2% lower YoY, which is a sequential improvement versus the previous week's YoY change of -7.7%


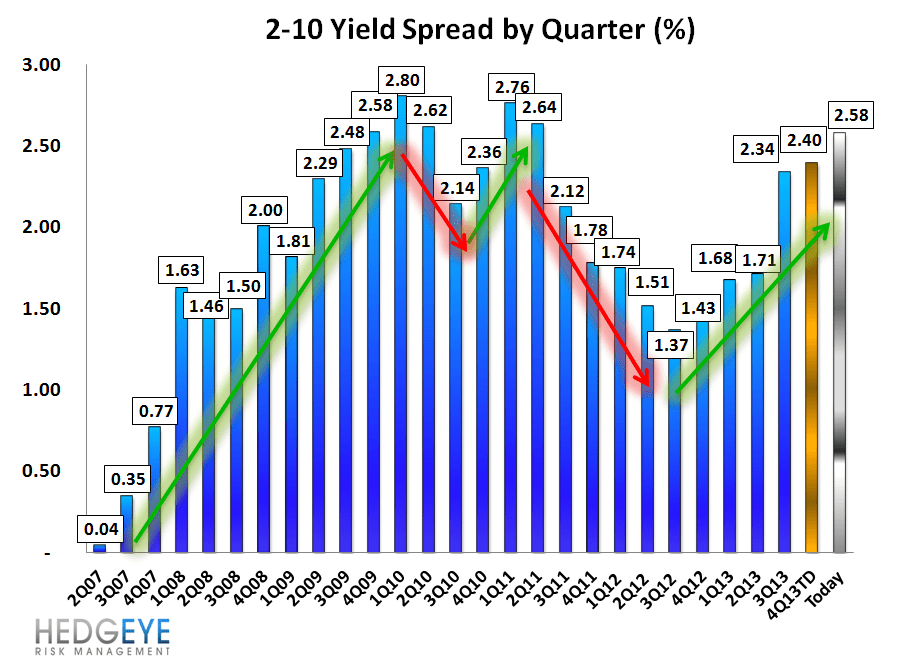
Yield Spreads
The 2-10 spread rose 6 basis points WoW to 258 bps. 4Q13TD, the 2-10 spread is averaging 240 bps, which is higher by 6 bps relative to 3Q13.

Joshua Steiner, CFA
Jonathan Casteleyn, CFA, CMT