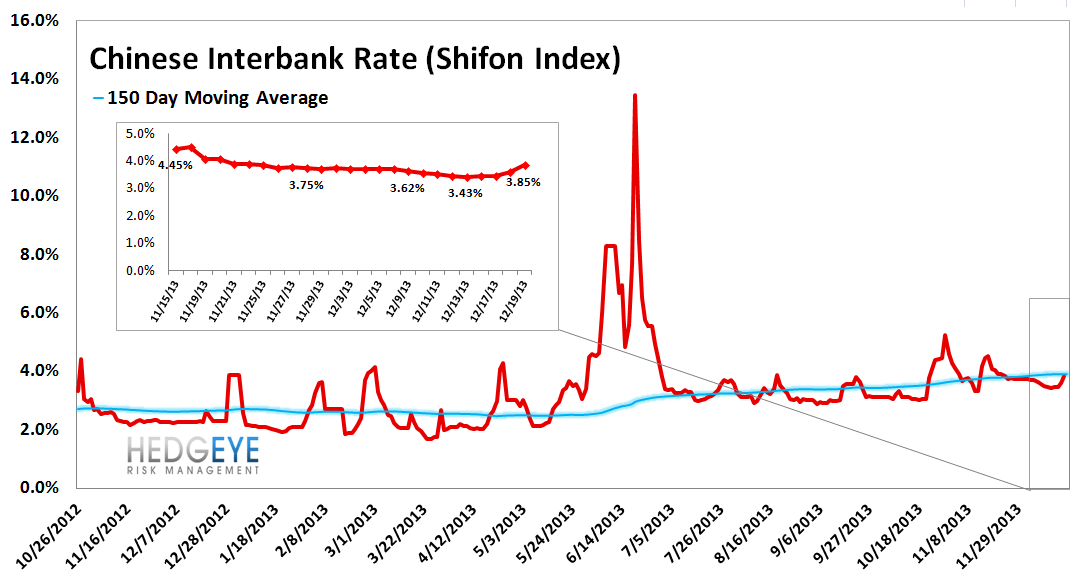
Europe's banks remain on a roll. Last week we saw further improvement in risk across the board. Our macro #EuroBulls theme continues to dovetail with what we're seeing on the banking side. On the negative side, the only notable risk change this week is the Chinese interbank rate, the Shifon Index, which rose 41 bps week-over-week to 3.85%. That being said, the Shifon remains roughly in-line with its level from a month earlier.
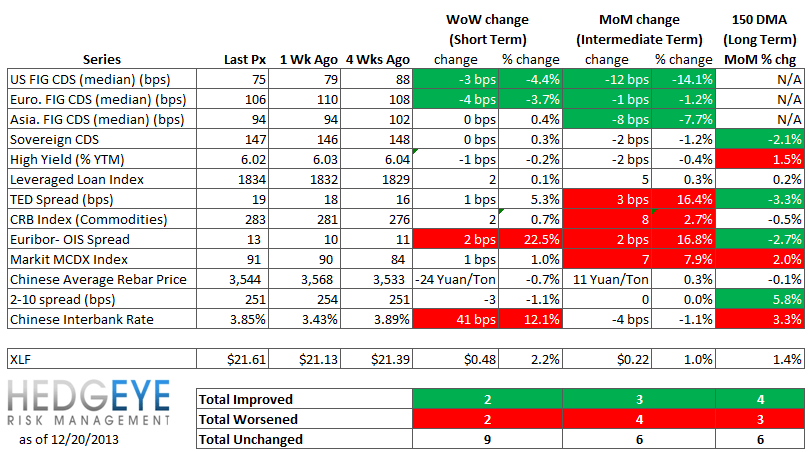
Financial Risk Monitor Summary
• Short-term(WoW): Negative / 2 of 13 improved / 2 out of 13 worsened / 9 of 13 unchanged
• Intermediate-term(WoW): Negative / 3 of 13 improved / 4 out of 13 worsened / 6 of 13 unchanged
• Long-term(WoW): Positive / 4 of 13 improved / 3 out of 13 worsened / 6 of 13 unchanged
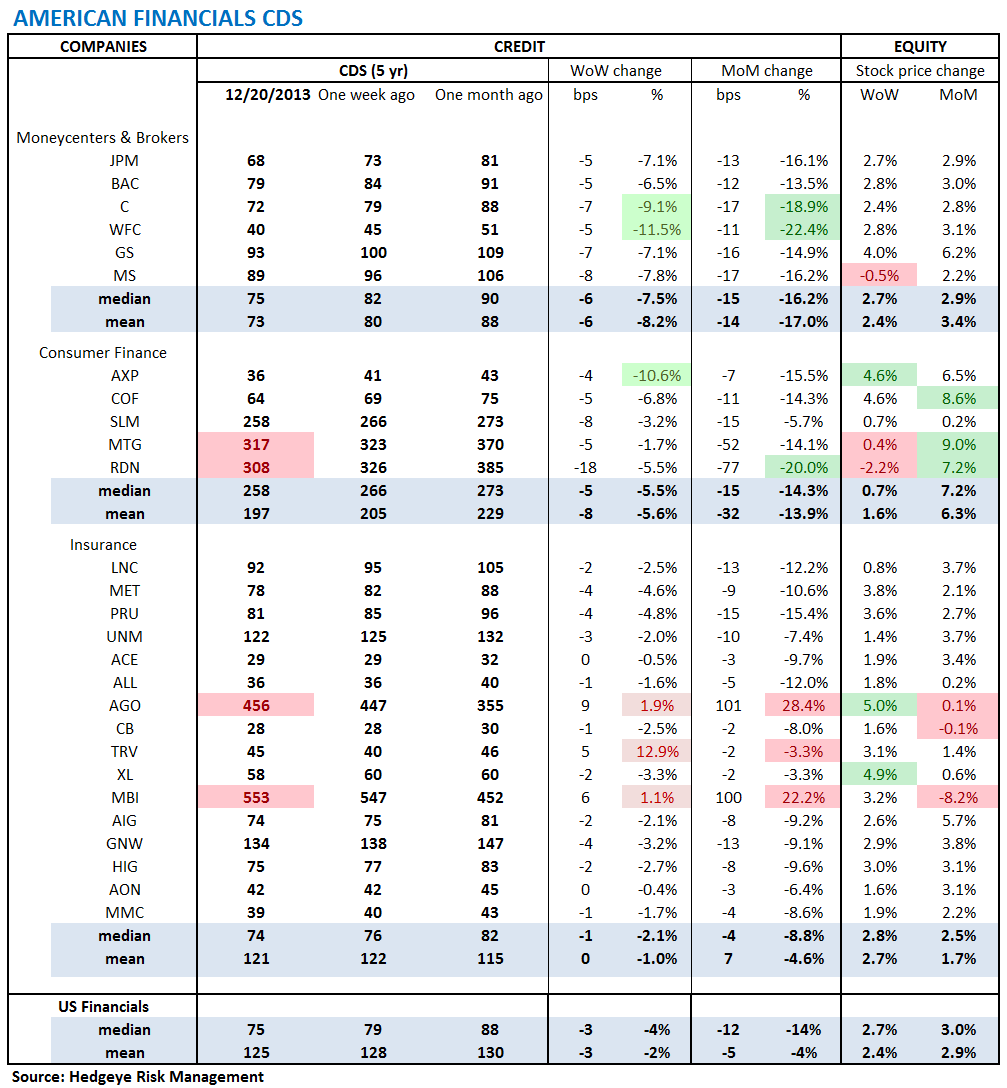
1. U.S. Financial CDS - Swaps tightened for 24 out of 27 domestic financial institutions and the largest improvements came from the large cap banks, where Citi, Goldman and Morgan tightened by 7-8 bps apiece. Radian (RDN) also posted a notable improvement at -18 bps.
Tightened the most WoW: WFC, AXP, C
Widened the most WoW: TRV, AGO, MBI
Tightened the most WoW: WFC, RDN, C
Widened the most/ tightened the least MoM: AGO, MBI, TRV
2. European Financial CDS - Swaps were sharply tighter last week across Europe. In fact, just 2 of 30 European banks were wider on the week. The biggest improvements came from the Spanish, Italian, German and Greek banks. It's safe to say that the recovery in Europe and Europe's banking system more generally remains alive and well.

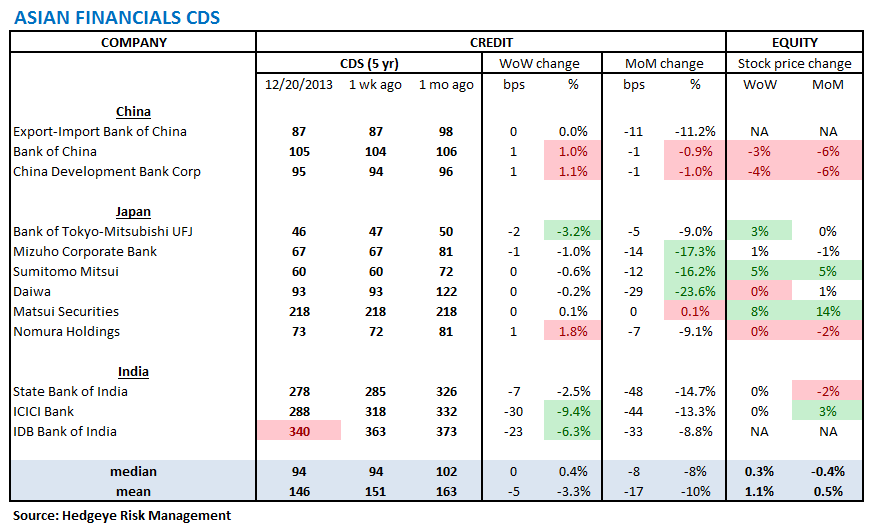
3. Asian Financial CDS - China and Japan were uneventful last week, but Indian bank swaps tightened dramatically once again. The month-over-month change in Indian Bank swaps is now 33-48 bps.
4. Sovereign CDS – Sovereign swaps mixed last week, but overall saw little movement. The average and median changes were zero. The largest postive and negative moves came from Spain (+4 bps) and Portugal (-5 bps).


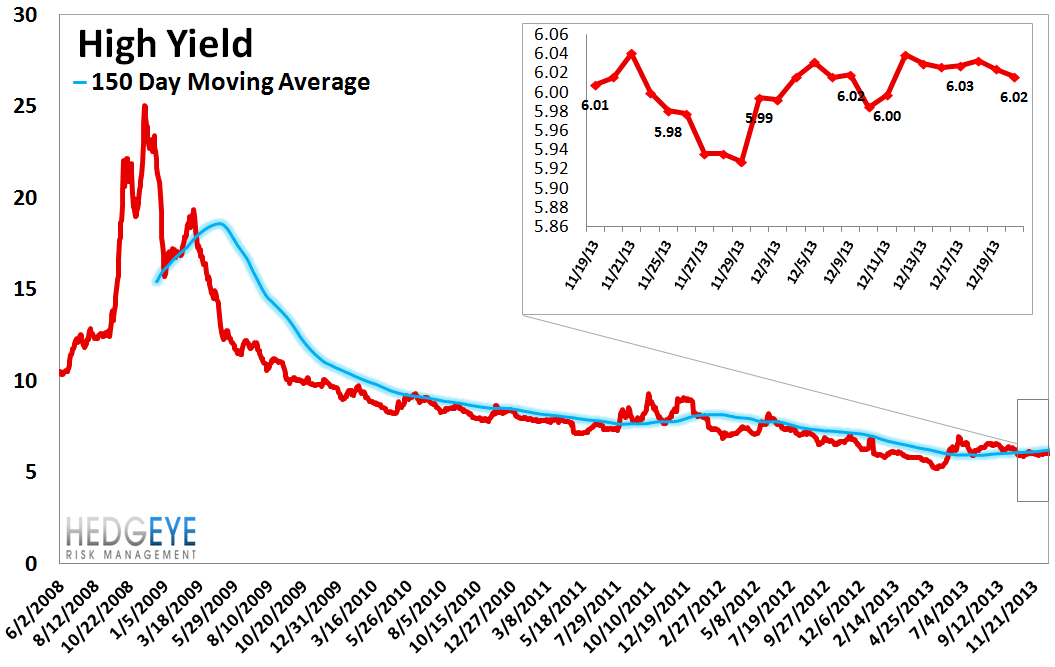
5. High Yield (YTM) Monitor – High yield rates fell 1.3 bps last week, ending the week at 6.02% versus 6.03% the prior week.
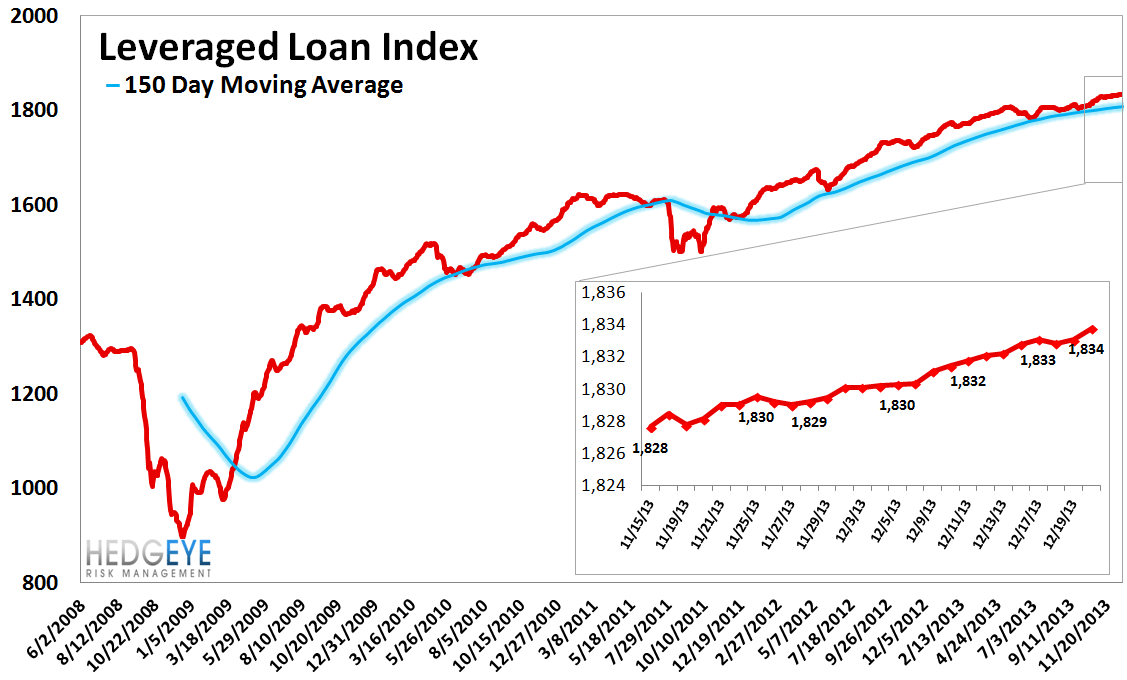
6. Leveraged Loan Index Monitor – The Leveraged Loan Index rose 2.0 points last week, ending at 1834.
7. TED Spread Monitor – The TED spread rose 0.9 basis points last week, ending the week at 19 bps this week versus last week’s print of 18.1 bps.

8. CRB Commodity Price Index – The CRB index rose 0.7%, ending the week at 283 versus 281 the prior week. As compared with the prior month, commodity prices have increased 2.7% We generally regard changes in commodity prices on the margin as having meaningful consumption implications.

9. Euribor-OIS Spread – The Euribor-OIS spread widened by 2 bps to 13 bps. The Euribor-OIS spread (the difference between the euro interbank lending rate and overnight indexed swaps) measures bank counterparty risk in the Eurozone. The OIS is analogous to the effective Fed Funds rate in the United States. Banks lending at the OIS do not swap principal, so counterparty risk in the OIS is minimal. By contrast, the Euribor rate is the rate offered for unsecured interbank lending. Thus, the spread between the two isolates counterparty risk.

10. Chinese Interbank Rate (Shifon Index) – The Shifon Index rose 41 basis points last week, ending the week at 3.84% versus last week’s print of 3.43%. The Shifon Index measures banks’ overnight lending rates to one another, a gauge of systemic stress in the Chinese banking system.
11. Markit MCDX Index Monitor – Last week spreads widened 1 bp ending the week at 91 bps versus 90 bps the prior week. The Markit MCDX is a measure of municipal credit default swaps. We believe this index is a useful indicator of pressure in state and local governments. Markit publishes index values daily on six 5-year tenor baskets including 50 reference entities each. Each basket includes a diversified pool of revenue and GO bonds from a broad array of states. We track the 16-V1.

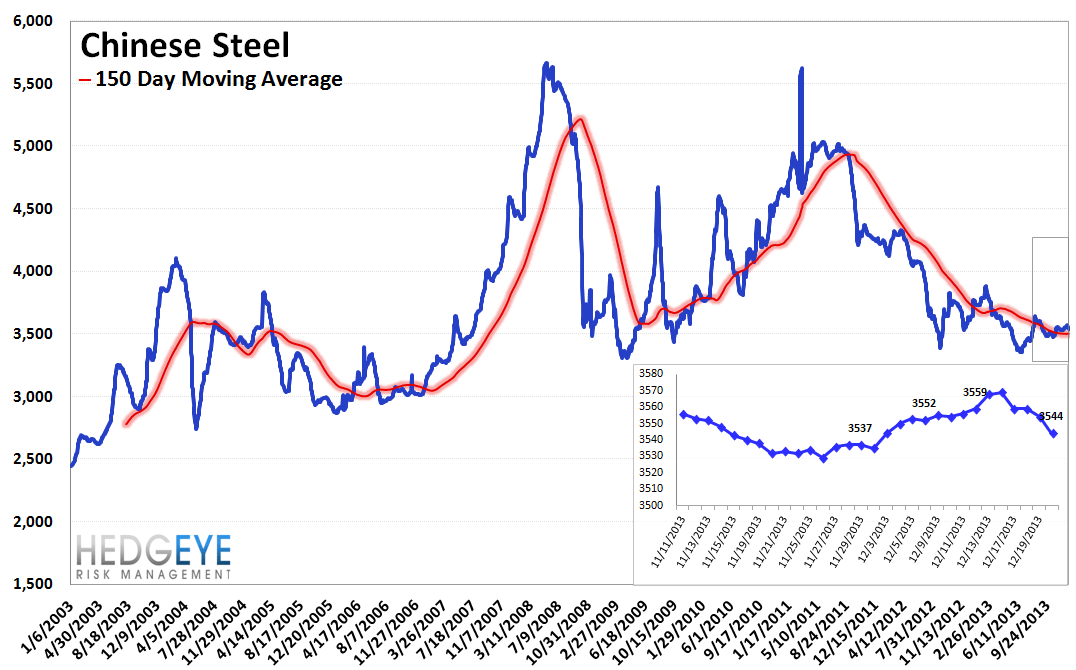
12. Chinese Steel – Steel prices in China fell 0.7% last week, or 24 yuan/ton, to 3544 yuan/ton. We use Chinese steel rebar prices to gauge Chinese construction activity, and, by extension, the health of the Chinese economy.
13. 2-10 Spread – Last week the 2-10 spread tightened to 251 bps, -3 bps tighter than a week ago. We track the 2-10 spread as an indicator of bank margin pressure.

14. XLF Macro Quantitative Setup – Our Macro team’s quantitative setup in the XLF shows 0.9% upside to TRADE resistance and 3.0% downside to TRADE support.

Joshua Steiner, CFA
Jonathan Casteleyn, CFA, CMT
