Investment Company Institute Mutual Fund Data and ETF Money Flow:
Total equity mutual funds experienced outflows for the week ending December 11th with $1.0 billion leaving the category, the first withdrawal in 9 weeks. Within the total equity outflow result, domestic equity mutual funds lost $5.6 billion, the biggest weekly outflow in U.S. stock funds year-to-date against International equity funds which posted a $4.5 billion inflow, a sequential improvement from the week prior. Total equity mutual fund trends in 2013 however now tally a $3.0 billion weekly average inflow, a complete reversal from 2012's $3.0 billion weekly outflow
Fixed income mutual funds continued persistent outflows during the most recent 5 day period with another $6.7 billion withdrawn from bond funds. This week's draw down worsened sequentially from the $4.4 billion outflow the week prior but ongoing redemptions have now forced the 2013 weekly average for all fixed income funds to a $1.3 billion outflow, which compares to the strong weekly inflow of $5.8 billion throughout 2012
ETFs experienced positive trends in the most recent 5 day period, with equity products seeing heavy inflows with fixed income ETFs also seeing moderate subscriptions week-to-week. Passive equity products gained $6.2 billion for the 5 day period ending December 11th with bond ETFs experiencing a $986 million inflow, an improvement from the $331 million redemption the 5 days prior. ETF products also reflect the 2013 asset allocation shift, with the weekly averages for equity products up year-over-year versus bond ETFs which are seeing weaker year-over-year results
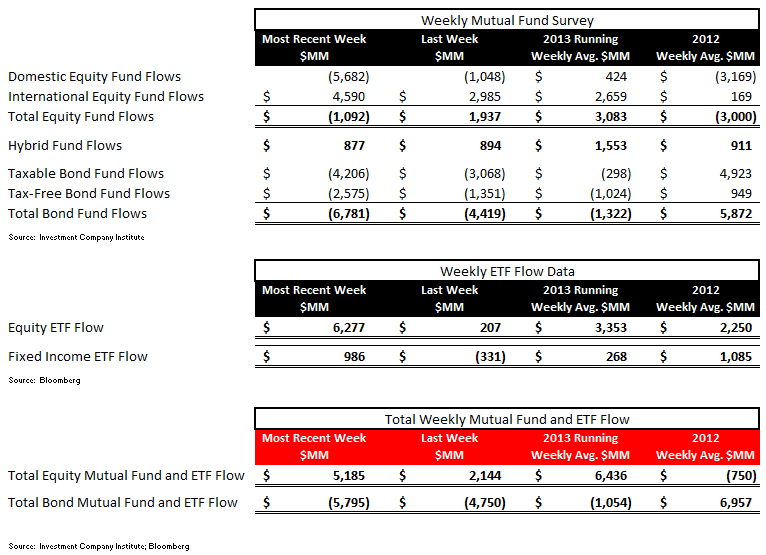
For the week ending December 11th, the Investment Company Institute reported slight equity outflows from mutual funds with over $1.0 billion flowing out of total stock funds. The breakout between domestic and world stock funds separated to a $5.6 billion outflow into domestic stock funds, the biggest weekly outflow for U.S. stock funds in 2013, and a $4.5 billion inflow into international or world stock funds, the biggest inflow since February for international funds. These results for the most recent 5 day period compared to the year-to-date weekly averages of a $424 million inflow for U.S. funds and a running $2.6 billion weekly inflow for international funds. The aggregate inflow for all stock funds this year now sits at a $3.0 billion inflow, an average which has been getting progressively bigger each week and a complete reversal from the $3.0 billion outflow averaged per week in 2012.
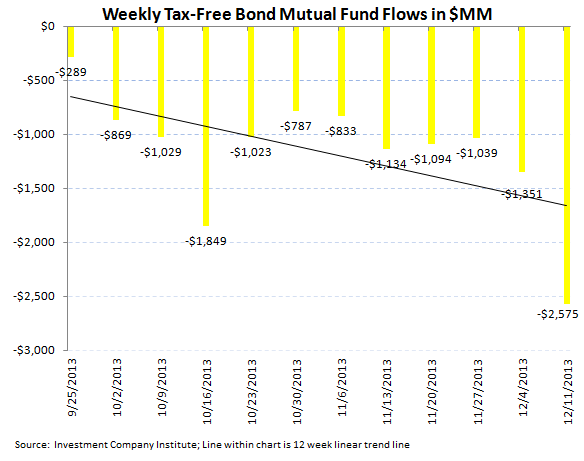
On the fixed income side, bond funds continued their weak trends for the 5 day period ended December 11th with outflows staying persistent within the asset class. The aggregate of taxable and tax-free bond funds booked a $6.7 billion outflow, a sequential deceleration from the $4.4 billion lost in the 5 day period prior. Both categories of fixed income contributed to outflows with taxable bonds having redemptions of $4.2 billion, which joined the $2.5 billion outflow in tax-free or municipal bonds, the worst 5 day period in muni bonds in 13 weeks. Taxable bonds have now had outflows in 24 of the past 28 weeks and municipal bonds having had 28 consecutive weeks of outflow. These redemptions late in the year are likely tax loss selling related with the Barclay's Aggregate Bond index down nearly 2% in 2013, the first annual loss in 14 years. The 2013 weekly average for fixed income fund flows is now a $1.3 billion weekly outflow, a sharp reversal from the $5.8 billion weekly inflow averaged last year.
Hybrid mutual funds, products which combine both equity and fixed income allocations, continue to be the most stable category within the ICI survey with another $877 million inflow in the most recent 5 day period, although the past 3 weeks have been below year-to-date averages. Hybrid funds have had inflow in 26 of the past 28 weeks with the 2013 weekly average inflow now at $1.5 billion, a strong advance versus the 2012 weekly average inflow of $911 million.


Passive Products:
Exchange traded funds had positive trends within the same 5 day period ending December 11th with equity ETFs posting a strong $6.2 billion inflow, the fourth consecutive week of positive equity ETF flow. The 2013 weekly average for stock ETFs is now a $3.3 billion weekly inflow, nearly a 50% improvement from last year's $2.2 billion weekly average inflow.
Bond ETFs experienced moderate inflow for the 5 day period ending December 11th, with a $986 million subscription, a reversal from the week prior which produced a $331 million outflow for passive bond products. Taking in consideration this most recent data however, 2013 averages for bond ETFs are flagging with just a $268 million average weekly inflow for bond ETFs, much lower than the $1.0 billion average weekly inflow for 2012.


Jonathan Casteleyn, CFA, CMT
Joshua Steiner, CFA
