Despite the volatility and persistent distortions in the Initial Jobless Claims data over the last few months, the underlying trend in the labor market remains one of steady improvement. Our Financials team breaks down this morning’s claims data in further detail below.
Elsewhere in domestic macro today, advance Retail Sales and Bloomberg’s weekly read on Consumer Confidence both came in strong.
RETAIL SALES: This mornings advance estimate of Retail Sales out of the Census Bureau reflected a positive October revision and strong November sales data across the various index aggregates. Headline and Core retail sales accelerated on a MoM, YoY, and 2Y basis with furniture and electronics driving strength in the control group. No need to over analyze this one – a solid report for the ~20% of the economy that is retail sales. A granular breakdown of the data in the table below.

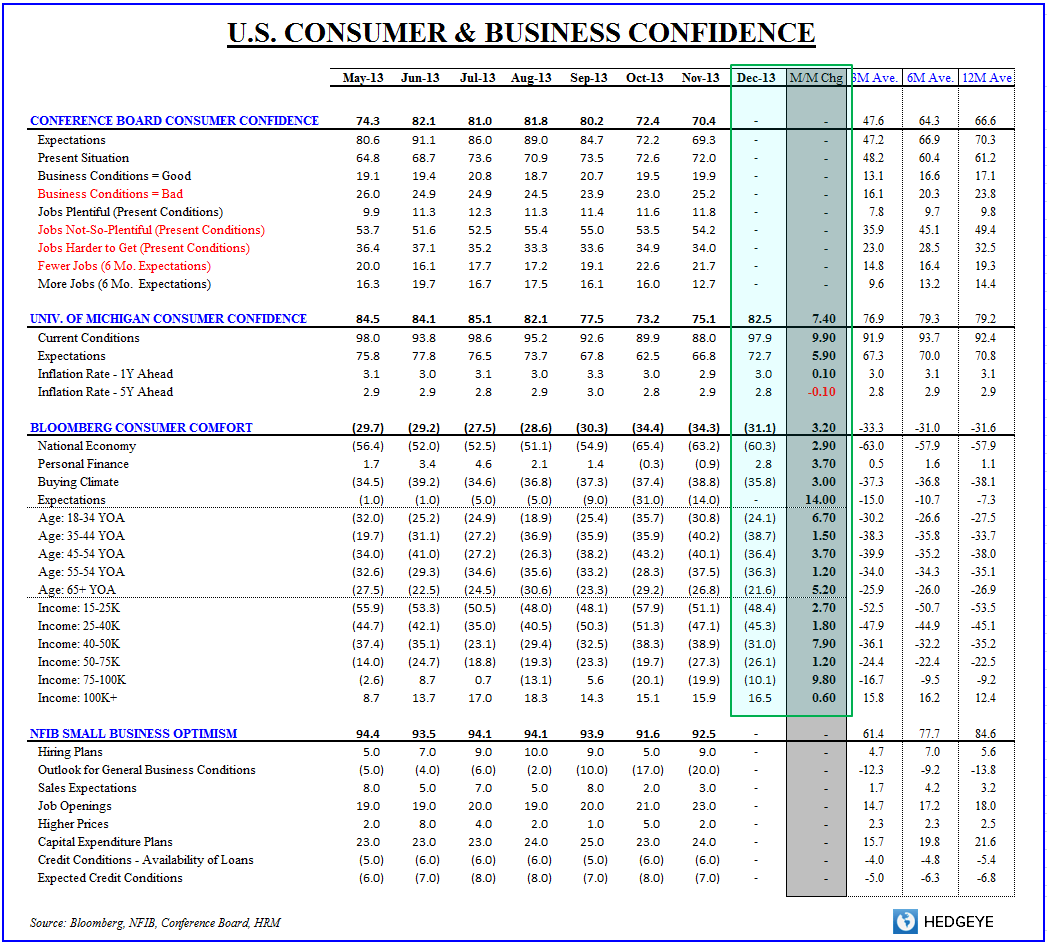
CONFIDENCE: After acutely tanking into and through the government shutdown in October, consumer and business confidence remained universally depressed across survey readings through November. Early December readings out of Bloomberg and the University of Michigan suggest that hangover is lifting.
The preliminary December reading from the Univ. of Michigan saw confidence improve +7.4 to 82.5 with the current conditions index leaping back towards mid-year highs.
Similarly, this morning's bloomberg consumer comfort reading improved again sequentially to -30.9, nearly back to pre-October levels. Absent another ‘exogenous shock’ and with the labor market improving and fiscal policy uncertainty ebbing on the margin, the path of least resistance for confidence appears to be higher.
- Hedgeye Macro
---------------------------------------------------------------------------------------------------------------------
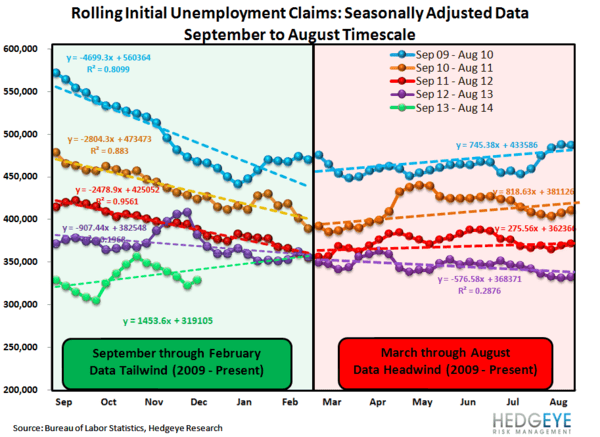
INITIAL CLAIMS: The One Chart That Best Explains the Situation
The chart below sums up the dynamic in the labor market quite well. It's a raw chart of NSA 1-week claims and it shows the mismatch the labor department's data is currently reflecting.
In 2008, 2009, 2010, 2011 and 2013 this last week was one in which claims historically surge, reflecting the seasonal layoffs following black Friday. 2012 was offset by a week making the comparability poor.
Just by eyeballing the chart, however, it looks pretty clear to us that the trend of steady improvement remains very much in place. There's no change to our view based on this most recent labor market datapoint.

The Data
Prior to revision, initial jobless claims rose 70k to 368k from 298k WoW, as the prior week's number was revised up by 2k to 300k.
The headline (unrevised) number shows claims were higher by 68k WoW. Meanwhile, the 4-week rolling average of seasonally-adjusted claims rose 6k WoW to 328.75k.
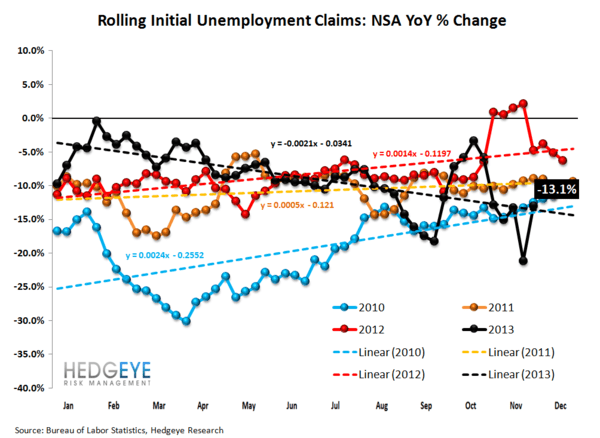
The 4-week rolling average of NSA claims, which we consider a more accurate representation of the underlying labor market trend, was -13.1% lower YoY, which is a sequential deterioration versus the previous week's YoY change of -21.2%
Joshua Steiner, CFA
Jonathan Casteleyn, CFA, CMT