Investment Company Institute Mutual Fund Data and ETF Money Flow:
Total equity mutual fund flow for the week ending December 4th was $1.9 billion, a below average weekly inflow for stock funds this year but none-the-less a slightly positive indication. Within the total equity inflow result, domestic equity mutual funds lost $1.0 billion, the second consecutive weekly outflow in U.S. stock funds with International equity funds posting a $2.9 billion inflow, on par with last week. Total equity mutual fund trends in 2013 however now tally a $3.2 billion weekly average inflow, a complete reversal from 2012's $3.0 billion weekly outflow
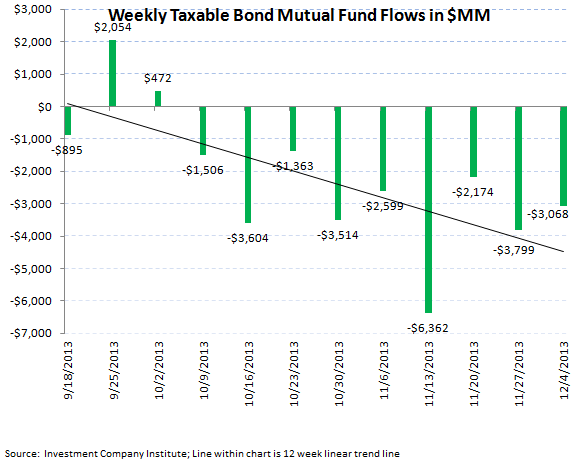
Fixed income mutual funds continued persistent outflows during the most recent 5 day period with another $4.4 billion withdrawn from bond funds. This week's draw down improved slightly sequentially from the $4.7 billion outflow the week prior but ongoing redemptions have now forced the 2013 weekly average for all fixed income funds to a $1.2 billion outflow, which compares to the strong weekly inflow of $5.8 billion throughout 2012
ETFs experienced mixed trends in the most recent 5 day period, with equity products seeing slight inflows and fixed income ETFs seeing moderate outflows week-to-week. Passive equity products gained $207 million for the 5 day period ending December 4th with bond ETFs experiencing a $331 million outflow, an acceleration from the $251 million redemption the 5 days prior. ETF products also reflect the 2013 asset allocation shift, with the weekly averages for equity products up year-over-year versus bond ETFs which are seeing weaker year-over-year results
With year-end tallies almost complete with only 2 full work weeks left in 2013, we have compiled the annual totals from the ICI for mutual fund results and also from Bloomberg for ETF production throughout 2013. In the Hedgeye Asset Management Thought of the Week below, we outline the resurgence in stock fund inflows, the emerging outflows in bond funds, and the record years for equity ETF inflow and commodity ETF outflows


For the week ending December 4th, the Investment Company Institute reported slight equity inflows into mutual funds with over $1.9 billion flowing into total stock funds. The breakout between domestic and world stock funds separated to a $1.0 billion outflow into domestic stock funds and a $2.9 billion inflow into international or world stock funds. These results for the most recent 5 day period within stock funds were bifurcated, with the outflow in domestic stock funds below the weekly average of a $551 million inflow and with world stock fund production slightly above the $2.6 billion weekly inflow average. The aggregate inflow for all stock funds this year now sits at a $3.2 billion inflow, an average which has been getting progressively bigger each week and a complete reversal from the $3.0 billion outflow averaged per week in 2012.
On the fixed income side, bond funds continued their weak trends for the 5 day period ended December 4th with outflows staying persistent within the asset class. The aggregate of taxable and tax-free bond funds booked a $4.4 billion outflow, a slight sequential improvement from the $4.7 billion lost in the 5 day period prior. Both categories of fixed income contributed to outflows with taxable bonds having redemptions of $3.0 billion, which joined the $1.3 billion outflow in tax-free or municipal bonds. Taxable bonds have now had outflows in 23 of the past 27 weeks and municipal bonds having had 27 consecutive weeks of outflow. While the sharp redemptions that marked most of the summer and the start of the third quarter have moderated, the appetite for bonds has hardly rebounded. The 2013 weekly average for fixed income fund flows is now a $1.2 billion weekly outflow, a sharp reversal from the $5.8 billion weekly inflow averaged last year.
Hybrid mutual funds, products which combine both equity and fixed income allocations, continue to be the most stable category within the ICI survey with another $894 million inflow in the most recent 5 day period, although the past 2 weeks have been below year-to-date averages. Hybrid funds have had inflow in 25 of the past 27 weeks with the 2013 weekly average inflow now at $1.5 billion, a strong advance versus the 2012 weekly average inflow of $911 million.


Passive Products:
Exchange traded funds had mixed trends within the same 5 day period ending December 4th with equity ETFs posting a slight $207 million inflow, a drastic drop from the $11.4 billion subscription the week prior. The 2013 weekly average for stock ETFs however is still a $3.3 billion weekly inflow, nearly a 50% improvement from last year's $2.2 billion weekly average inflow.
Bond ETFs experienced a moderate outflow for the 5 day period ending December 4th, with a $331 million redemption a sequential acceleration from the week prior which produced a $251 million outflow for passive bond products. Taking in consideration this most recent data, 2013 averages for bond ETFs are flagging with just a $253 million average weekly inflow for bond ETFs, much lower than the $1.0 billion average weekly inflow for 2012.


Hedgeye Asset Management Thought of the Week:
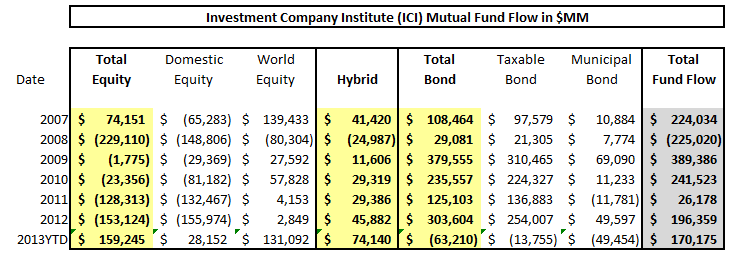
Some analysts as well as media outlets are still in denial about the start of a rotation from U.S. fixed income into U.S. stocks, however the debate in our minds is a short one. With only a few weeks left in 2013, we have compiled the year-to-date flow totals from the Investment Company Institute for mutual funds and from Bloomberg for exchange traded funds. The trends from our perspective are quite clear. Within mutual funds, the $1 trillion that has come into bond funds since 2008 (or the start of the Fed's quantitative easing program) has started to unwind with the first outflow in fixed income funds within the ICI data since 2007. The fixed income outflow of $63 billion through the first 49 weeks of 2013 still pales in comparison to the $303 billion inflow that came into fixed income last year in 2012 (can you say blow off top?) and also the record year of 2009 when the Great Rotation from stocks into bonds started and $379 billion came into fixed income funds. While the over $155 billion outflow in the back half of 2013 has been the sharpest bond outflow in history (most significant 27 week ouflow sequence), the first half of 2013 experienced nearly $100 billion of inflow into fixed income to net to the fairly insignificant outflow year-to-date of $63 billion currently. Our regression model of bond performance to bond outflows continues to forecast a total outflow of $200 billion through 2014 meaning that this current rotation from bonds into equities could have quite a tail to go.
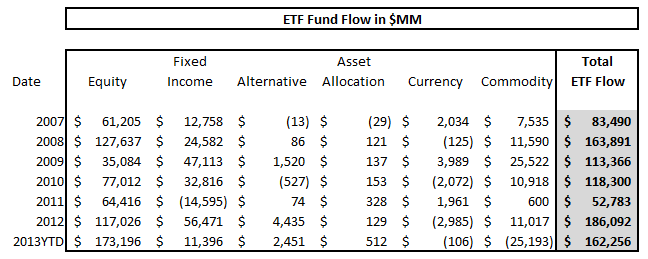
Conversely, the nascent production in stock funds (while consistently dismissed) has been historically quite impressive being double that of the $74 billion that came into equity mutual funds in 2007. While the $159 billion running inflow into stock funds thus far in 2013 has had an international fund bend ($131 billion has gone into international stock funds versus just $28 billion into domestic equity funds), there is still ample reason to think that U.S. stocks can continue this turn in redemptions that has plagued them for all 6 years of ICI data before '13 (still record amount of cash on U.S. corporate balance sheets, generally low yields can allow stocks higher multiples, and the unwinding of the commodity super cycle and U.S. bond fund outflows needing to be invested somewhere). Bloomberg's annual tally of ETF information has equally interesting thematic value with the strong mutual fund trends in equities being validated on the stock ETF side, with another record year for ETF inflow (equity ETFs for 2013 have netted $173 billion in '13, higher than the $117 billion in '12 and a new record from the prior high of $127 billion in 2008). Fixed income interest in ETFs is matching its mutual fund brethren as well with passive bond products taking in a paltry $11.3 billion in 2013, a drastic drop from the record $56.4 billion last year (even the new fast growing ETF vehicle is not summoning up new interest from investors with the potential multi-year down cycle in fixed income). Commodity ETFs have had a year to forget with the formerly exuberrant gold market having been knocked down for a 20% plus loss and incrementally higher U.S. interest rates broadly supporting a higher dollar which has sent overall commodity indices lower. Commodity specific ETFs have had a record $25.1 billion redemption this year, the first negative year since the start of our data set in 2007, and a far cry from the formerly worst year of just a $600 million inflow in 2011.
We don't estimate that a substantial change from these current trends will occur until mid 2014 (these current themes are intact with forthcoming Fed tapering to continue to hurt the demand for fixed income and that U.S. stocks can at least have a positive start to 2014). Thus our favorite long idea remains T Rowe Price (TROW), a manager with industry leading equity performance to hoover up new industry equity flows and also a strong balance sheet to seed new products and also continue its streak of 26 consecutive years of dividend increases.
Jonathan Casteleyn, CFA, CMT
Joshua Steiner, CFA
