Investment Company Institute Mutual Fund Data and ETF Money Flow:
Total equity mutual fund flow for the week ending November 27th was $1.5 billion, a below average weekly inflow for 2013 but none-the-less a slightly positive indication for stocks. Within the total equity inflow result, domestic equity mutual funds lost $1.3 billion, the first outflow in 6 weeks with International equity funds posting a $2.9 billion inflow. Total equity mutual fund trends in 2013 however now tally a $3.2 billion weekly average inflow, a complete reversal from 2012's $3.0 billion weekly outflow
Fixed income mutual funds continued persistent outflows during the most recent 5 day period with another $4.7 billion withdrawn from bond funds. This week's draw down worsened sequentially from the $3.2 billion outflow the week prior which has now forced the 2013 weekly average for all fixed income funds to an $1.1 billion outflow which compares to the strong weekly inflow of $5.8 billion throughout 2012
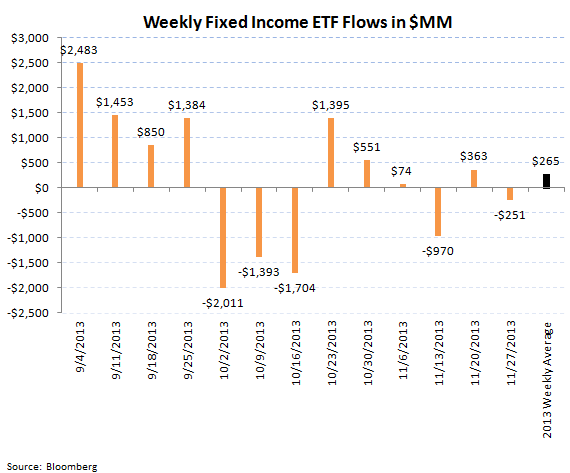
ETFs experienced mixed trends in the most recent 5 day period, with equity products seeing very strong inflows and fixed income ETFs seeing slight outflows week-to-week. Passive equity products gained $11.4 billion for the 5 day period ending November 27th, the 5th best week in all of 2013. Bond ETFs experienced a $251 million outflow, a deceleration from the $363 million subscription in the 5 days prior. ETF products also reflect the 2013 asset allocation shift, with the weekly averages for equity products up year-over-year versus bond ETFs which are seeing weaker year-over-year results


For the week ending November 27th, the Investment Company Institute reported slight equity inflows into mutual funds with over $1.5 billion flowing into total stock funds. The breakout between domestic and world stock funds separated to a $1.3 billion outflow into domestic stock funds and a $2.9 billion inflow into international or world stock funds. These results for the most recent 5 day period within stock funds were bifurcated, with the outflow in domestic stock funds below the weekly average of a $597 million inflow and with world stock fund production slightly above the $2.6 billion weekly inflow average. The aggregate inflow for all stock funds this year now sits at a $3.2 billion inflow, an average which has been getting progressively bigger each week and a complete reversal from the $3.0 billion outflow averaged per week in 2012.
On the fixed income side, bond funds continued their weak trends for the 5 day period ended November 27th with outflows staying persistent within the asset class. The aggregate of taxable and tax-free bond funds booked a $4.7 billion outflow, a sequential deterioration from the $3.2 billion lost in the 5 day period prior. Both categories of fixed income contributed to outflows with taxable bonds having redemptions of $3.6 billion, which joined the $1.0 billion outflow in tax-free or municipal bonds. Taxable bonds have now had outflows in 22 of the past 26 weeks and municipal bonds having had 26 consecutive weeks of outflow. While the sharp outflows that marked most of the summer and the start of the third quarter have moderated, the appetite for bonds has hardly rebounded. The 2013 weekly average for fixed income fund flows is now a $1.1 billion weekly outflow, a sharp reversal from the $5.8 billion weekly inflow averaged last year.
Hybrid mutual funds, products which combine both equity and fixed income allocations, continue to be the most stable category within the ICI survey with another $870 million inflow in the most recent 5 day period. Hybrid funds have had inflow in 24 of the past 26 weeks with the 2013 weekly average inflow now at $1.6 billion, a strong advance versus the 2012 weekly average inflow of $911 million.


Passive Products:
Exchange traded funds had mixed trends within the same 5 day period ending November 27th with equity ETFs posting a very strong $11.4 billion inflow, a sequential improvement from the $4.0 billion subscription the week prior and the 5th best week all year for stock ETFs. The 2013 weekly average for stock ETFs is now a $3.3 billion weekly inflow, nearly a 50% improvement from last year's $2.2 billion weekly average inflow.
Bond ETFs experienced a slight outflow for the 5 day period ending November 27th with a $251 million redemption, a sequential deceleration from the week prior which netted a $363 million inflow for passive bond products. Taking in consideration this most recent data, 2013 averages for bond ETFs are flagging with just a $265 million average weekly inflow for bond ETFs, much lower than the $1.0 billion average weekly inflow for 2012.

Jonathan Casteleyn, CFA, CMT
Joshua Steiner, CFA