SUMMARY:
I love everything about investing except maybe the fact that I’m actually in the investment industry. If you saw how sausage was made you probably wouldn’t eat it.
The allure of a skillfully prepared valuation narrative, however, remains one of the industry’s most enticing, sirenic delicacies. The market is expensive here but valuation is (still) not a catalyst. Tops are processes, the price signal remains bullish currently and, up through the present, we have continued BTDB’ing (Buying the Damn Bubble) while taking down our gross and net equity exposure since the September 18th, No-Taper announcement.
VALUATION: BLOVIATION & CONSTERNATION
It has been hard to escape the valuation discussion the last few weeks as bubble speculation has been ubiquitous alongside higher nominal (& real) highs for domestic equities. Reviewing a cross-section of market valuation measures (below), the summary takeaway is pretty straightforward – across the balance of metrics, equities are, indeed, moving towards overvalued on a historical basis.
The problem, of course, is that the overbought-overvalued market narrative is a tired one as moderately elevated valuation has characterized most of 2013 and prices advancing at a premium to profits is not a new phenomenon – particularly in what could (amazingly still) be considered an “early cycle”, liquidity supported stage of the recovery.
VALUATION IS (STILL) NOT A CATALYST:
We use a broad range of valuation and sentiment indicators when contemplating the direction of markets and where our view sits in the context of current prices, consensus estimates, and prevailing sentiment. From an Investment decision making perspective, valuation sits somewhere near the middle-bottom of the our consideration hierarchy.
So, rather than claiming right to some specific valuation-in-isolation based insight on the immediate term direction for equities, below we survey a cross-section of canonical market valuation measures to provide some historical context for current multiples.
In terms of how we are managing the current environment: With fund flows, decent macro, rising M&A activity, bullish price momentum, near universal acknowledgement of the existent “bubbliness”, and the lack of a discrete negative catalyst all supporting equities in the immediate term, we’ll continue to ride the bull until the price signal changes. Prune & plant within our immediate term risk ranges while holding an elevated cash balance.
As Keith noted this morning: “This is a raging bull market, until it isn't.”
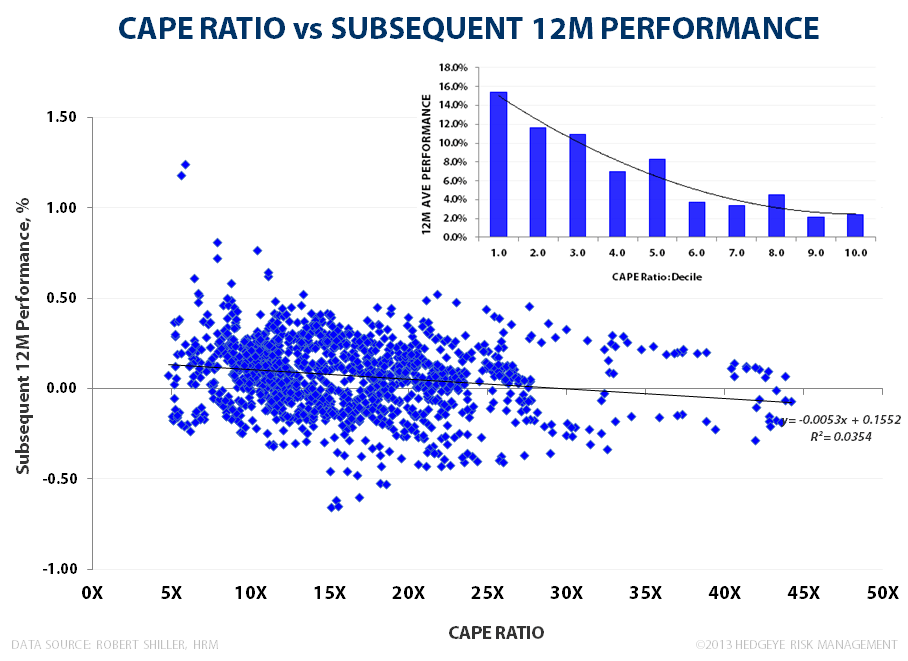
CAPE/Shiller PE: At 24.9, the CAPE ratio (inflation-adjusted SPX price divided by the 10Y average of inflation adjusted earnings) is moving into the top decile of its historical range. Below we’ve broken the historical CAPE ratio values into deciles and looked at average market performance over the subsequent 1Y and 3Y periods. The mapping of the Shiller PE vs subsequent market performance suggests return expectations should move systematically lower alongside incremental increases in valuation. Historically, 1Y and 3Y returns progressively decline for each decile change in the Shiller PE.


Tobins Q-Ratio: Longer-term valuation arguments center on the premise that returns on capital should equalize to cost of capital and market values should normalize to economic value. Tobin’s Q ratio is not a measure we use to tactically manage risk, but we can appreciate the intuition (why buy an asset when you can “re-create” it for less and compete away existing, excess profit) underneath its application.
Historically, at extremes, it has served as a solid lead signal for subsequent market performance. We are sitting just below the 1.0 level currently and approximately 1.0 standard deviation above the long-term mean value – a level that has generally not been a harbinger of positive forward returns historically.

S&P 500 Market Cap-to-GDP: Assuming the collective output of SPX constituents credibly reflects aggregate national production (or serves as a credible proxy for it), the Market Capitalization-to-GDP ratio effectively represents a price to sales multiple for the economy. As can be seen, on a historical basis, we are certainly entering “expensive” territory as we push towards breaching 100% to the upside.

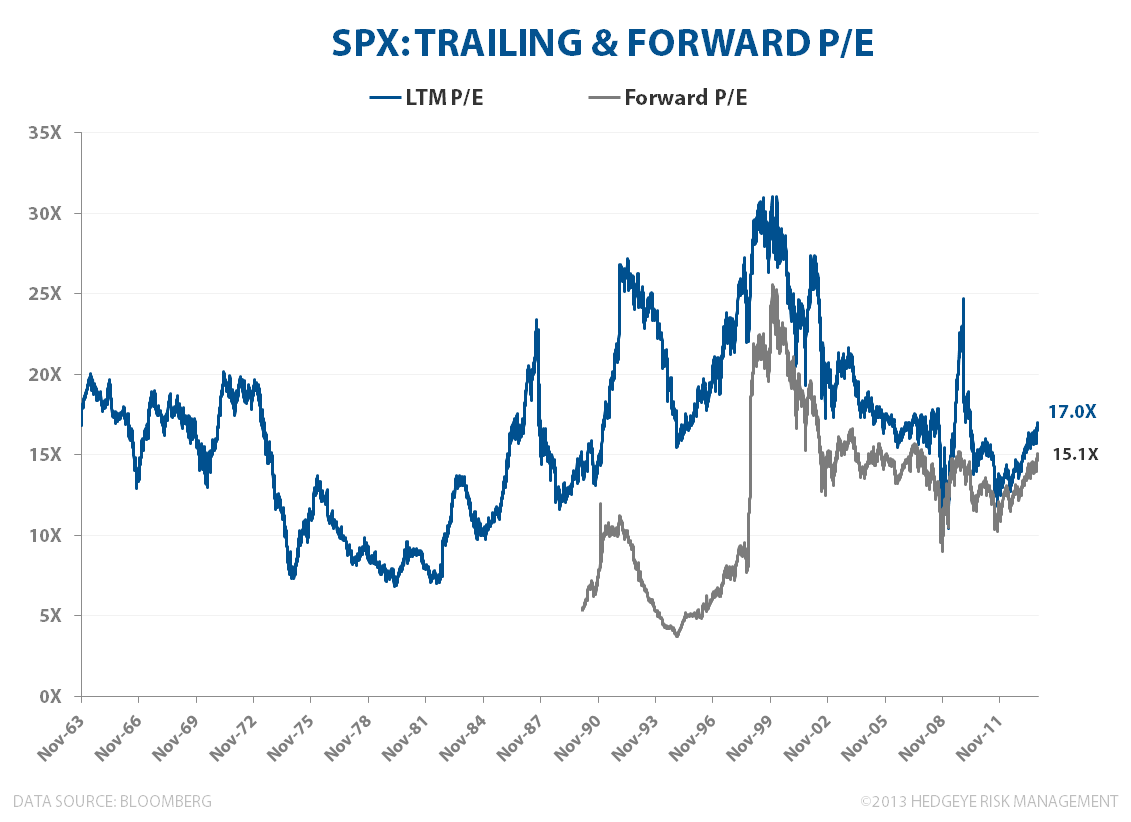
FORWARD/TRAILING P/E: On conventional LTM & NTM P/E metrics, the market is moderately expensive at present. Valuing the market on 1Y of (recurrently over-optimistic) forward earnings estimates has its pitfalls and, additionally, any perceived cheapness in current multiples should be discounted to account for mean reversion downside off peak corporate profitability (more below).
MARKET COMPS AND PEAK MARGINS: Operating Margins remain near peak with Corporate Profitability continuing to make higher highs with after-tax corporate profits advancing to a record 11% of GDP in 2Q13 – some 85% above the long-term average at current levels . Unless you think peak returns to capital provide a sustainable path to aggregate demand growth in the face of negative trend growth in real earnings, trough returns to labor, middling productivity growth and secularly depressed investment spending, then the mean reversion risk for margins remains asymmetrically to the downside.
Topline growth estimates for the SPX (mkt weighted) don’t look unreasonable at +4.8% for 2014. Expectations look similar across SPX constituents on an equal weighted basis with median 2Y growth estimates reflecting modest acceleration over the next four quarters. However, the slope on earnings growth (+10.9% for 2014) over the NTM continues to look overly aggressive given expectations for further, significant margin expansion above already peak corporate profitability.


Christian B. Drake
Associate
