Investment Company Institute Mutual Fund Data and ETF Money Flow:
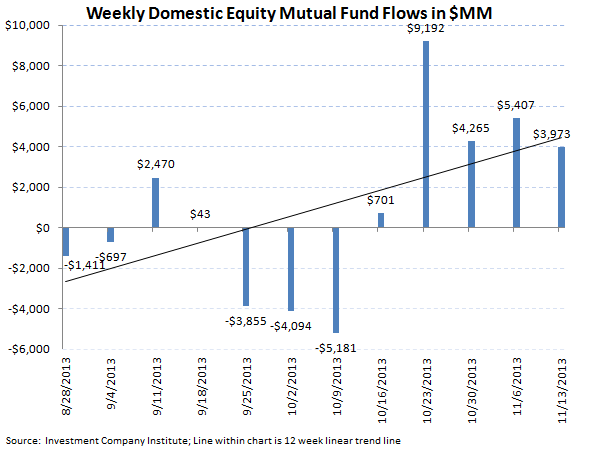
Total equity mutual fund flow for the week ending November 13th was a strong $7.2 billion, the eighth best week in all of 2013 and the fourth consecutive week over the $7 billion weekly inflow mark. Domestic equity mutual fund flow was $3.9 billion, an slight deceleration from the week prior with world equity funds collecting $3.2 billion in new investor capital. Total equity mutual fund trends in 2013 however now tally a $3.1 billion weekly average inflow, a complete reversal from 2012's $3.0 billion weekly outflow
Fixed income mutual funds continued persistent outflows during the most recent 5 day period with another $7.5 billion withdrawn from bond funds, the worst week in over 2 months. This week's draw down worsened sequentially from the $4.2 billion outflow the week prior which has now forced the 2013 weekly average for all fixed income funds to an $1.0 billion outflow which compares to the strong weekly inflow of $5.8 billion throughout 2012
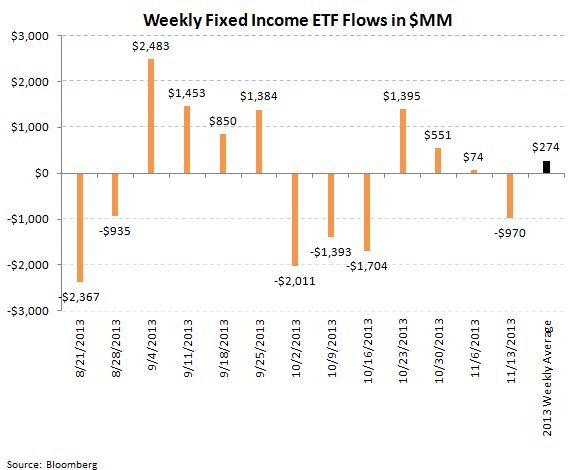
ETFs experienced mixed trends in the most recent 5 day period, with equity products seeing slight outflows and fixed income ETFs seeing slight inflows week-to-week. Passive equity products lost $338 million for the 5 day period ending November 13th, a sequential improvement from the $4.9 billion outflow the week prior, with bond ETFs experiencing a $274 million inflow, also an improvement from the $74 million subscription in the 5 day prior. ETF products also reflect the 2013 asset allocation shift, with the weekly averages for equity products up year-over-year versus bond ETFs which are seeing weaker year-over-year results
In the Hedgeye Asset Management Thought of the Week below, we outline that the current 2013 running redemption within fixed income mutual funds is actually still below the prior bond outflow cycles of 1994, 1999, and 2003 which means that even more substantial fixed income outflows would not be abnormal


For the week ending November 13th, the Investment Company Institute reported the 8th best week in 2013 for equity inflows with over $7.2 billion flowing into total equity mutual funds. The breakout between domestic and world stock funds separated to a $3.9 billion inflow into domestic stock funds and a $3.2 billion inflow into international or world stock funds. Both results for the most recent 5 day period within stock funds were above the 2013 weekly averages, with the domestic stock fund 2013 weekly mean at just a $628 million inflow and world stock funds having averaged a $2.5 billion weekly inflow during 2013. The aggregate inflow for all stock funds this year now sits at a $3.1 billion inflow, an average which has been getting progressively bigger each week and a complete reversal from the $3.0 billion outflow averaged per week in 2012.
On the fixed income side, bond funds continued their weak trends for the 5 day period ended November 13th with outflows staying persistent within the asset class. The aggregate of taxable and tax-free bond funds booked a $7.5 billion outflow, a sequential deterioration from the $4.3 billion lost in the 5 day period prior and the worst redemption in 11 weeks. Both categories of fixed income contributed to outflows with taxable bonds having redemptions of $6.4 billion, which joined the $1.1 billion outflow in tax-free or municipal bonds. Taxable bonds have now had outflows in 19 of the past 24 weeks and municipal bonds having had 24 consecutive weeks of outflow. While the sharp outflows that marked most of the summer and the start of the third quarter have moderated, the appetite for bonds has hardly rebounded. The 2013 weekly average for fixed income fund flows is now a $1.0 billion weekly outflow, a sharp reversal from the $5.8 billion weekly inflow averaged last year.
Hybrid mutual funds, products which combine both equity and fixed income allocations, continue to be the most stable category within the ICI survey with another $1.4 billion inflow in the most recent 5 day period. Hybrid funds have had inflow in 20 of the past 22 weeks with the 2013 weekly average inflow now at $1.6 billion, a strong advance versus the 2012 weekly average inflow of $911 million.


Passive Products:
Exchange traded funds had mixed trends within the same 5 day period ending November 13th with equity ETFs posting a slight $338 million outflow, a sequential improvement from the larger $4.9 billion redemption the week prior. The 2013 weekly average for stock ETFs is now a $3.1 billion weekly inflow, nearly a 50% improvement from last year's $2.2 billion weekly average inflow.
Bond ETFs managed a slight inflow for the 5 day period ending November 13th with a $274 million subscription, a sequential improvement from the week prior which netted a $74 million inflow for passive bond products. Taking in consideration this most recent data, 2013 averages for bond ETFs are flagging with just a $274 million average weekly inflow for bond ETFs, much lower than the $1.0 billion average weekly inflow for 2012.

Hedgeye Asset Management Thought of the Week - The 2013 Drawdown is Still Below Average:
While the fixed income mutual fund asset class is firmly in outflow with taxable mutual funds having had outflows in 19 of the past 24 weeks and tax-free or municipal bonds having had redemptions in 24 consecutive weeks, we none-the-less highlight that this sequence of outflows is still running below average on a percentage of beginning bond fund assets historically. The drawdowns of 2003-2004, 1, and the notorious bond redemption of 1 all resulted in bigger losses on beginning bond fund outstandings. Respectively, the '03-'04 redemption resulted in 5.0% of beginning bond fund assets being lost, a similar percentage to the 1 bond outflow cycle which drew down over 5.0% of beginning fixed income assets. These losses however were a far cry from the 14.0% of beginning bond fund assets which were redeemed in 1994 when the Federal Reserve surprisingly raised rates at the time. The 2013 redemption sequence, which started in May, has now resulted in nearly $150 billion having been pulled out of bond funds however on a percentage basis, this redemption is just a 3.9% loss on beginning bond fund assets. Thus solely on historical precedent, another $40 billion in bond outflows on the current $3.8 trillion bond fund outstandings would match the losses in '03/'04 and in 1999/2000, however another $380 billion could flow out of the bond category to match the 1994 redemption sequence. In our roll-out of the asset management sector in August, we fore-casted over a $1 trillion shift out of fixed income over a multi-year time period to give investor's a broader perspective.

Jonathan Casteleyn, CFA, CMT
Joshua Steiner, CFA
