This note was originally published November 07, 2013 at 09:20 in Financials

Investment Company Institute Mutual Fund Data and ETF Money Flow:
Total equity mutual fund flow followed through after the record week last week with another strong inflow of $7.9 billion for the 5 day period ending October 30th, well above the 2013 weekly average inflow of $2.9 billion. Domestic equity mutual fund flow was $4.2 billion in the most recent period with world equity funds collecting $3.6 billion in new investor capital. Total equity mutual fund trends in 2013 now tally the aforementioned $2.9 billion weekly average inflow, a total reversal from 2012's $3.0 billion weekly outflow
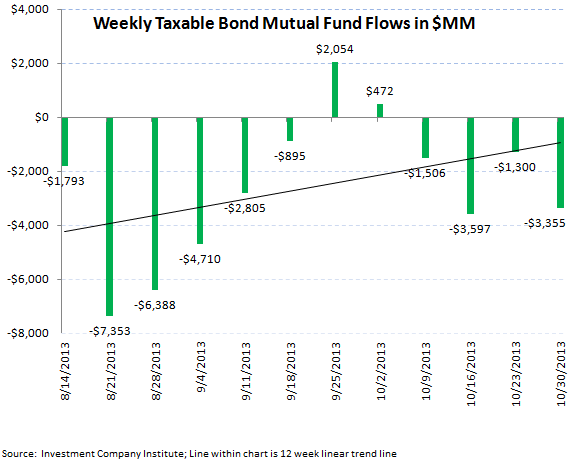
Fixed income mutual funds continued persistent outflows during the most recent 5 day period with another $4.1 billion withdrawn from bond funds. This week's draw down worsened sequentially from the $2.3 billion outflow the week prior which has now forced the 2013 weekly average for all fixed income funds to a $798 million outflow which compares to the strong weekly inflow of $5.8 billion throughout 2012
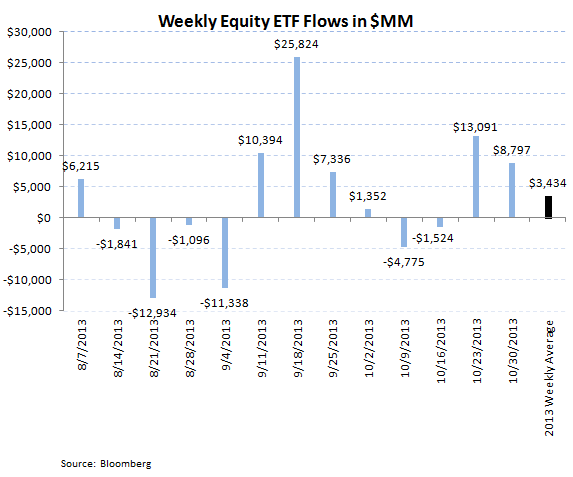
ETFs experienced declining weekly subscriptions in the most recent 5 day period, with both equity and fixed income ETFs seeing smaller inflows week-to-week. Passive equity products took in $8.7 billion for the 5 day period ending October 30th, a sequential weekly decline, with bond ETFs experiencing a $551 million inflow, also a smaller inflow than the week prior. ETF products also reflect the 2013 asset allocation shift, with the weekly averages for equity products up year-over-year versus bond ETFs which are seeing weaker year-over-year results


For the week ending October 30th, the Investment Company Institute reported another strong weekly subscription within equity funds with another $7.9 billion inflow into total equity mutual funds. The breakout between domestic and world stock funds separated to a $4.2 billion inflow into domestic stock funds and a $3.6 billion inflow into international or world stock funds. Both results for the most recent 5 day period within stock funds were above the 2013 weekly averages, with the domestic stock fund 2013 weekly mean at just a $442 million inflow and world stock funds having averaged a $2.5 billion inflow during 2013. The aggregate inflow for all stock funds now sits at a $2.9 billion inflow, a complete reversal from the $3.0 billion outflow averaged per week in 2012.
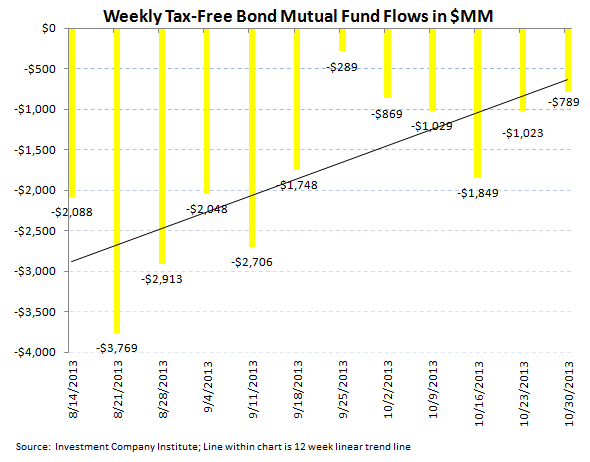
On the fixed income side, bond funds continued their weak trends for the 5 day period ended October 30th with outflows staying persistent within the asset class. The aggregate of taxable and tax-free bond funds booked a $4.1 billion outflow, a sequential deterioration from the $2.3 billion lost in the 5 day period prior. Both categories of fixed income contributed to outflows with taxable bonds having redemptions of $3.3 billion, which joined the $789 million outflow in tax-free or municipal bonds. Taxable bonds have now had outflows in 17 of the past 22 weeks and municipal bonds having had 22 consecutive weeks of outflow. While the sharp outflows that marked most of the summer and the start of the third quarter have moderated, the appetite for bonds has hardly rebounded. The 2013 weekly average for fixed income fund flows is now a $798 million weekly outflow, a sharp reversal from the $5.8 billion weekly inflow averaged last year.
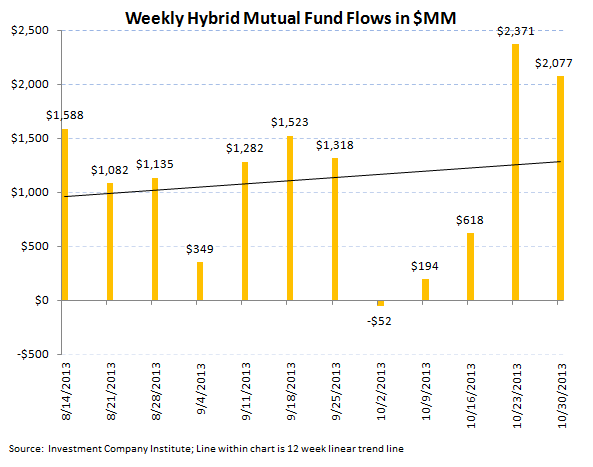
Hybrid mutual funds, products which combine both equity and fixed income allocations, continue to be the most stable category within the ICI survey with another $2.0 billion inflow in the most recent 5 day period. Hybrid funds have had inflow in 18 of the past 20 weeks with the 2013 weekly average inflow now at $1.6 billion, a strong advance versus the 2012 weekly average inflow of $911 million.


Passive Products:
Exchange traded funds booked inflows on both sides of the ledger with equity ETFs posting a $8.7 billion inflow, a sequential decline from the very strong $13.0 billion subscription the week prior. The 2013 weekly average for stock ETFs is now a $3.4 billion weekly inflow, a 50% improvement from last year's $2.2 billion weekly average inflow.
Bond ETFs managed an inflow for the 5 day period ending October 30th with a $551 million subscription, also a sequential decline from the week prior which netted a $1.3 billion inflow for passive bond products. Taking in consideration this most recent data, 2013 averages for bond ETFs are flagging with just a $308 million average weekly inflow for bond ETFs, much lower than the $1.0 billion average weekly inflow for 2012.

Jonathan Casteleyn, CFA, CMT
203-562-6500
Joshua Steiner, CFA
203-562-6500
