First let’s look at the reality of this company. We think that the base business is in the bottom quartile of businesses we’d like to invest in. Consider trends in the third quarter. Innerwear sales are down for the second time this year. Ditto for Activewear. And yes, those two businesses combined account for 83% of sales and 95% of cash flow. Direct to Consumer was finally up for the first time in five quarters, but barely so – sales were up 0.9%. This is an area we feel strongly about. No company – and I don’t care who it is – should be putting up sales growth in DTC anything less than 10%. The good companies are looking at 20%. The great companies are better than 30%. Does the underwear business naturally lend itself to a wholesale business? Yes, perhaps. But growth in the DTC channel is synonymous to the health of the brand in question.
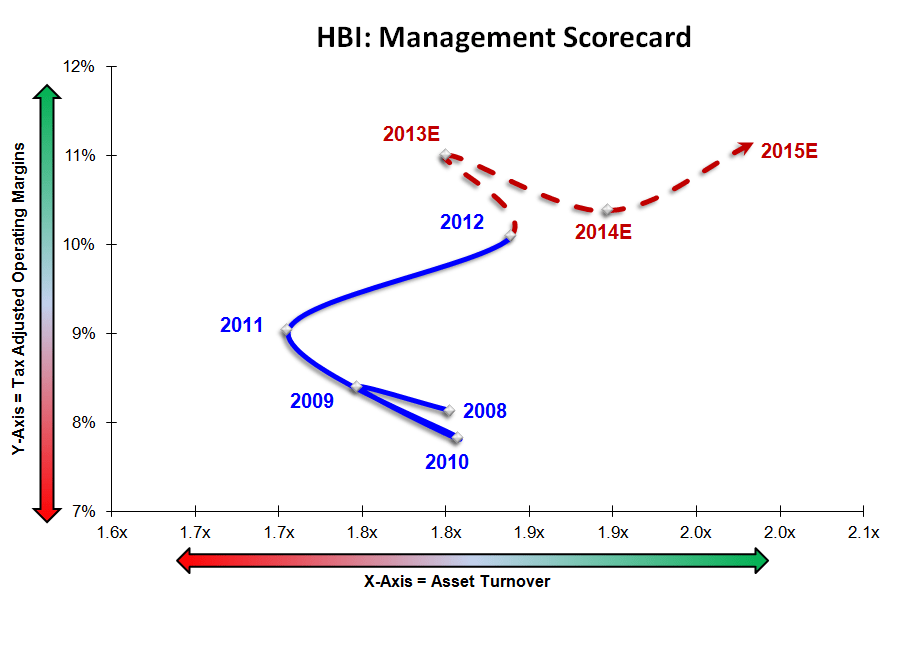
Lastly, the trajectory of the balance sheet relative to the P&L is not looking good at all. Check out HBI’s SIGMA chart below. The clockwise motion is a classic pattern of a company that follows the patterns of either the economic cycle or an industry-specific cycle. But the interpretation is plain as day: Margins were in trouble for four quarters, but the company fixed its inventory levels along the way (which made the line gravitate upward throughout 2012). But then inventory/sales got consistently less good, but people were ok with that because margins were improving. That’s what happened over the past nine months. But the latest data point here denotes considerable erosion in both inventory/sales AND margins. For the record, you don’t want to see those two things coincide if you’re long the stock.

Then why, HedgeyeRetail, do you think that the stock will continue to head higher?
That belief lies entirely with Maidenform, and the sheer fact that management continues to sandbag the accretion math. Consider the following. The reality on Maidenform is that a) HBI got it for a steal, b) management lowballed on accretion as they simply add it to HBI’s model, c) there’s easy margin upside as HBI unravels failed MFB programs put in place over the past two years, and d) there’s further upside as HBI fills out its excess capacity with MFB business (i.e. transitions MFB to an insourced model from an outsourced model). They guided to $0.15-$0.20 per share from MFB in 2014. Seriously? If we simply add on MFB’s net income from last year – which was abysmal, by the way (worst in 8-years) and then tack on borrowing costs, we get to $0.25-$0.30 in accretion. When all is said and done, we think the accretion numbers will be at least 2x guidance in year 1, and could be closer to a buck versus management’s $0.60 guidance three years out.
That’s why we get to the RNOA trajectory in the chart below. It is one of the best in retail, and it’s all due to MFB. Margins getting better while asset turns are improving.
The bottom line is that it does not matter one iota that sales are punk. We might start to see some positive benefit from HBI’s organic marketing initiatives in 2H – but that gives them maybe a point or two in growth. The big upside begins in another two quarters when HBI gets 15% sales growth alone just from adding MFB. Along the way, cash flow looks good, and the company looks on track to pay down the debt associated with the deal just over a year after it closes. Organically, we’re not fans of this story by any stretch (challenged top line and cotton-led gross margin benefit coming to a close). But the reality is that the market won’t look at the ‘organic growth and margin characteristics’, it will look at reported numbers, and lowballed expectations. As a merged entity, this one will be tough to bet against.
