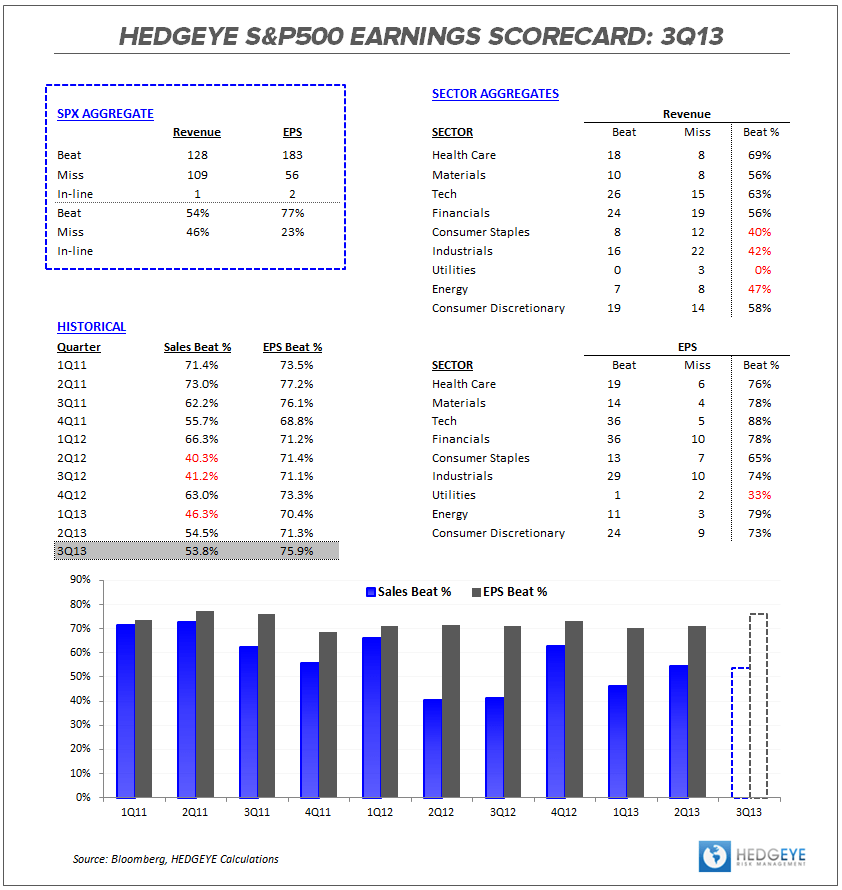
Fighting for Parity: With just about half of SPX constituent companies having reporting, half have beaten topline estimates, half are registering positive acceleration in fundamentals, and just over half of companies beating earnings estimates have subsequently outperformed beta.
Beat-Miss: The Sales-EPS beat-miss spread is widening a bit here thus far in 3Q with 54% and 76% of companies beating top and bottom line estimates, respectively. This compares with 54%/71% in 2Q and a TTM average of 51%/72%.
Style Factor Performance: The marked divergence in results vs expectations between high-growth and slow-growth style factors we observed to start earnings season has tightened up a bit this week. On balance, were seeing results across Larger Cap, Higher Leverage, Low Yield, High Beta equities perform better vs. prevailing topline estimates than their inverses.

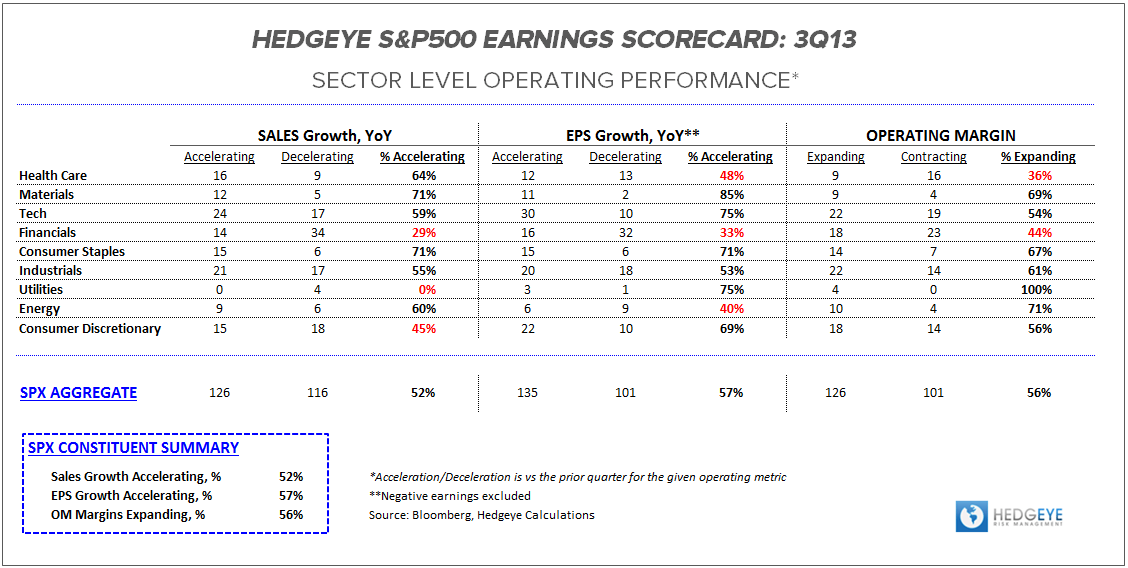
Fundamental Performance: Fighting to stay above the parity line with 52% and 57% of companies registering sequential acceleration in sales growth and earnings growth, respectively. Margin performance has been similar with 56% of companies reporting sequential operating margin expansion according to bloomberg data. From a sector perspective, Healthcare and Financials remained the fundamental laggards while Materials, Tech and Staples are generally reflecting improving growth/margin trends.
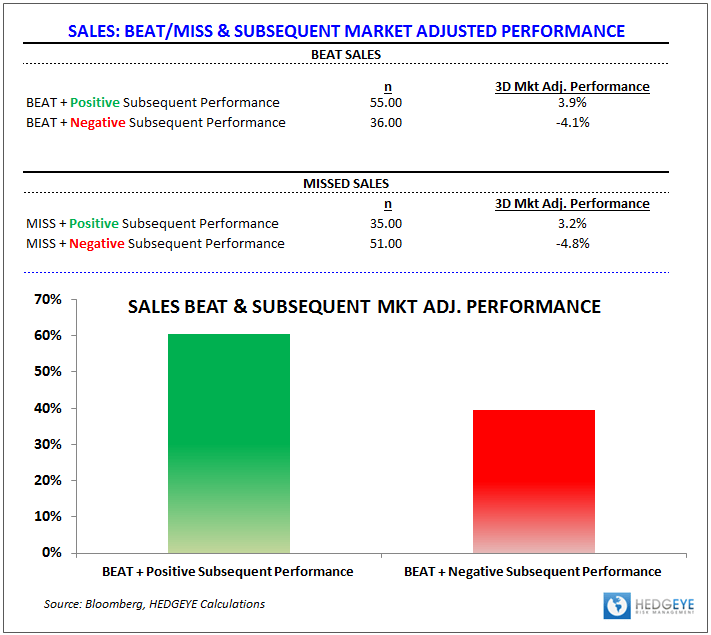
Has the Print Mattered? In a word, not really. Below we chart company Beats & Misses vs subsequent market adjusted 3-day performance.
- Sales: 60% of companies that beat sales estimates subsequently outperformed the market to the tune of 3.9% on average. The other 40% of companies that beat sales estimates underperformed the market over the subsequent 3-days by an average of -4.0%. Subsequent performance for companies missing Sales estimates was similarly mixed.
- EPS: 54% of companies beating EPS estimates subsequently outperformed the market by ~3% on average while 46% went on to underperform the market by an average of -4.2%. Subsequent performance for companies missing EPS estimates was similarly mixed.

Enjoy the weekend.
Christian B. Drake
Associate
