California Exits the Data (Mostly) and Now the Data Looks Pretty Good
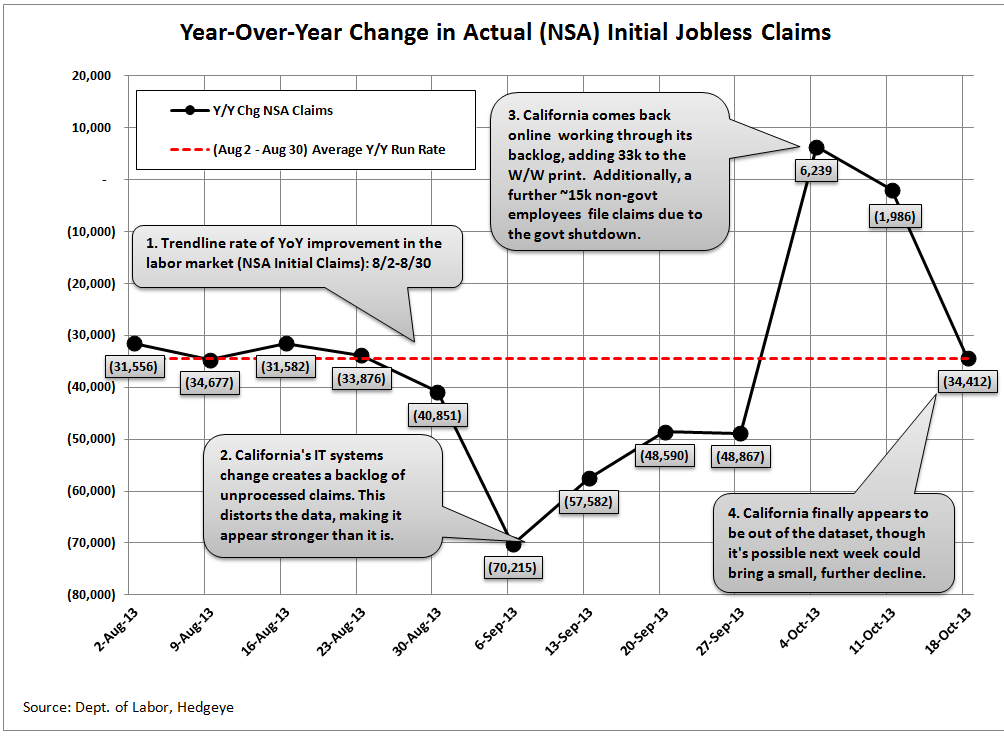
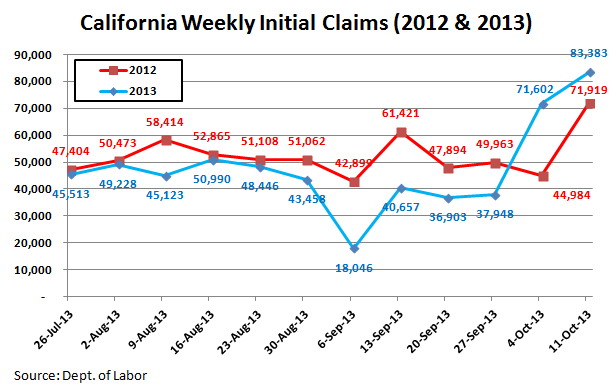
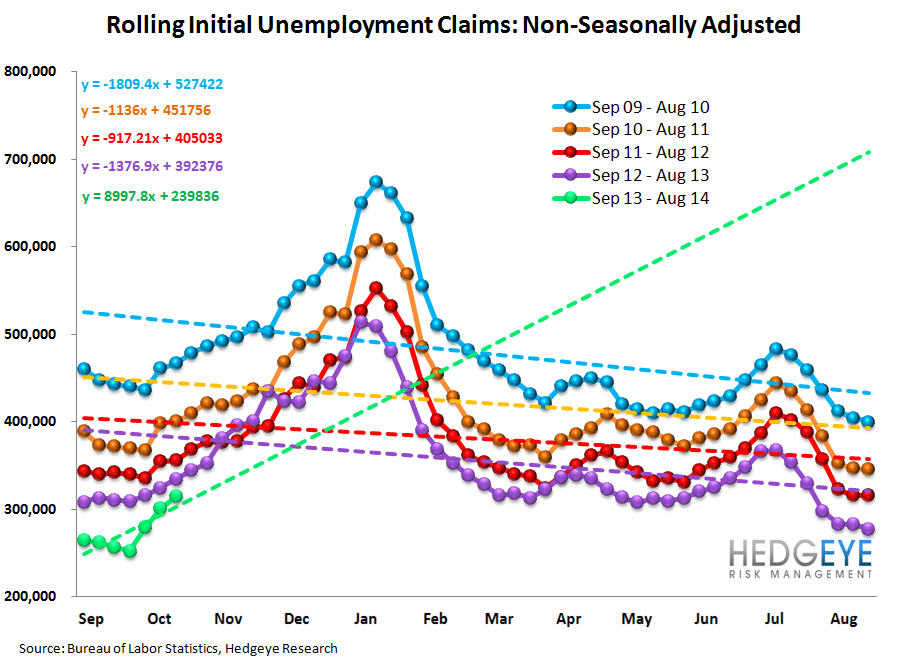
Last week we focused on the impact that distortions from California were having on the perceptions of the labor market. This week we'll revisit that theme. Take a look at the first two charts below. The first chart shows the Y/Y change in NSA initial claims by week since the start of August. The red line shows the average amount of Y/Y change for the month of August, a reasonable baseline trend ahead of the distortion. We then see the impact of the California and govt shutdown on the data, first suppressing it and then inflating it. Based on this morning's data, it appears that the NSA series is back to baseline. The Y/Y change in NSA claims this morning was a decline of 34,412 vs the same week last year. That compares with the August 2013 average of a decline of 34,508 Y/Y. The media is reporting that California is still not caught up, but either that's not true, or the underlying data is stronger today than what we were seeing in August, when claims were improving at a rate of 10-11% Y/Y. The second chart shows California in isolation. The key here is that state level data is only available on a 1-week lag. Consequently, we're looking at last week's numbers since they're the most current available. You can see that as of last week, California reported 83,383 initial claims, which was up about 11k Y/Y from 2012. The trend had been that 2013 claims were coming in at a rate of roughly 21k lower Y/Y, so we would expect to see a roughly 33k sequential improvement this week and that's almost exactly what we saw (again, see the first chart below).
The bottom line is this. The seasonally-adjusted NFP numbers reported Tuesday reflect the low watermark in the labor market. This is no surprise, as August/September have represented the low watermark for the past 5 years due to the distortive effects of Lehman Brothers on the seasonal adjustment models. Just as we've seen in the past 4 years, we would expect the "perceived" labor market data to steadily strengthen over the coming 5-6 months through the Feb/Mar 2014 timeframe and carry with it a steadily rising market but also a steadily rising expectation for tapering sometime in the late first quarter or second quarter of 2014. Plan accordingly.
Revisiting the Ghost of Lehman
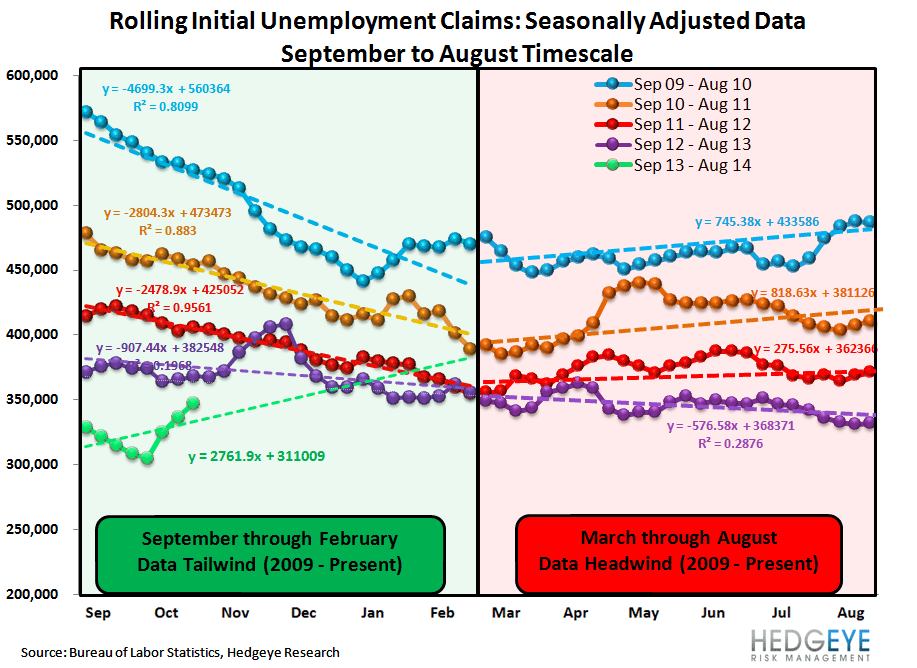
For a look at multiple charts illustrating the serious seasonality distortion in NFP caused by Lehman's economic ripples refer to our macro team's note from Tuesday, entitled: "September Employment: Marking the Low?" We've included one chart from that note below (the third chart down). It shows that in each of the past 4 years, the average positive trendline improvement from September through February has been 118k monthly jobs (i.e. you're 118k higher in Feb than you were in Sep). Conversely, the average negative trendline change from March through August has been -56k monthly jobs (i.e. you're 56k lower in August than you were in March). Translation, the market thinks we're at a 140k monthly NFP run rate right now, but by March, the market will think we're at 250-260k. That will create a very different environment for Fed expectations.

Nuts & Bolts
Prior to revision, initial jobless claims fell 8k to 350k from 358k WoW, as the prior week's number was revised down by 0k to 358k.
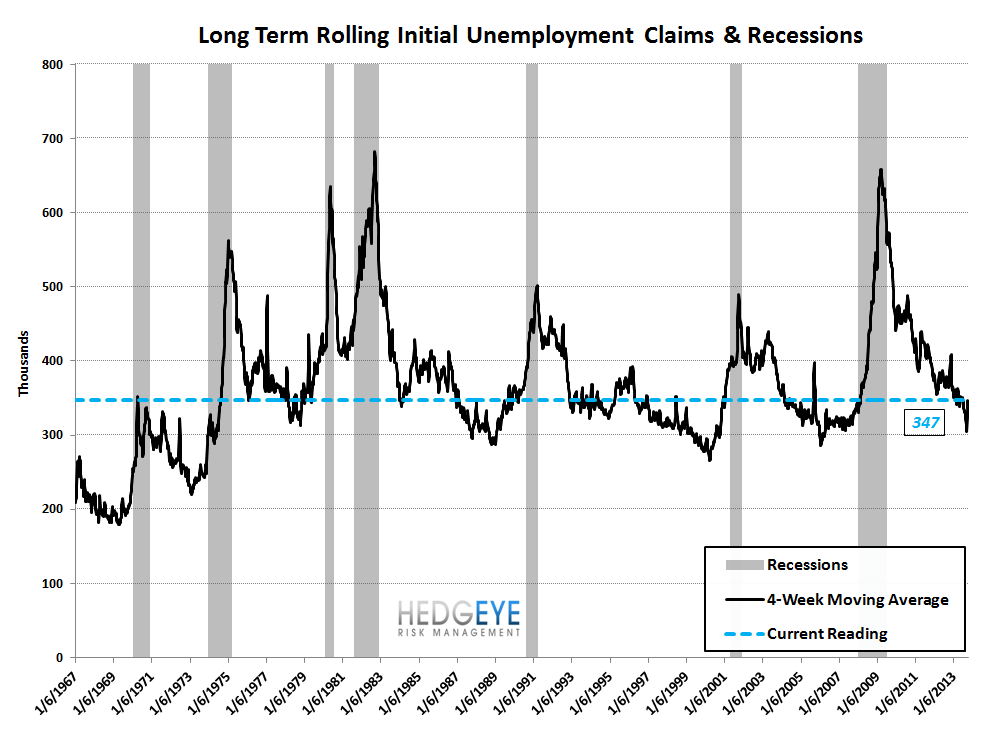
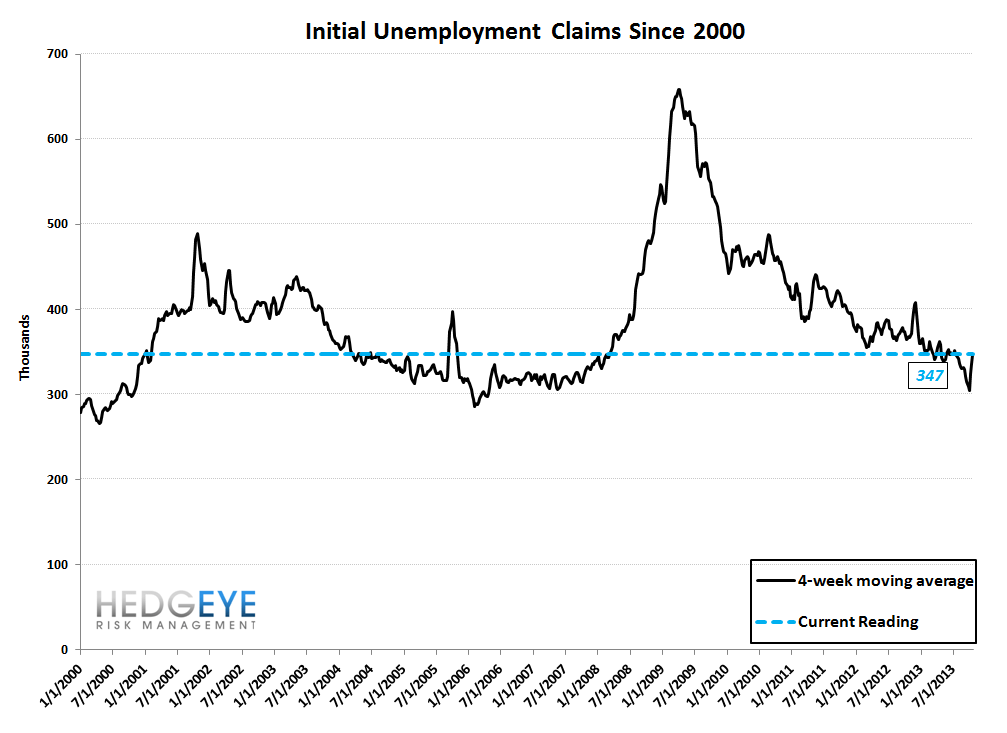
The headline (unrevised) number shows claims were lower by 8k WoW. Meanwhile, the 4-week rolling average of seasonally-adjusted claims rose 10.5k WoW to 347.25k.
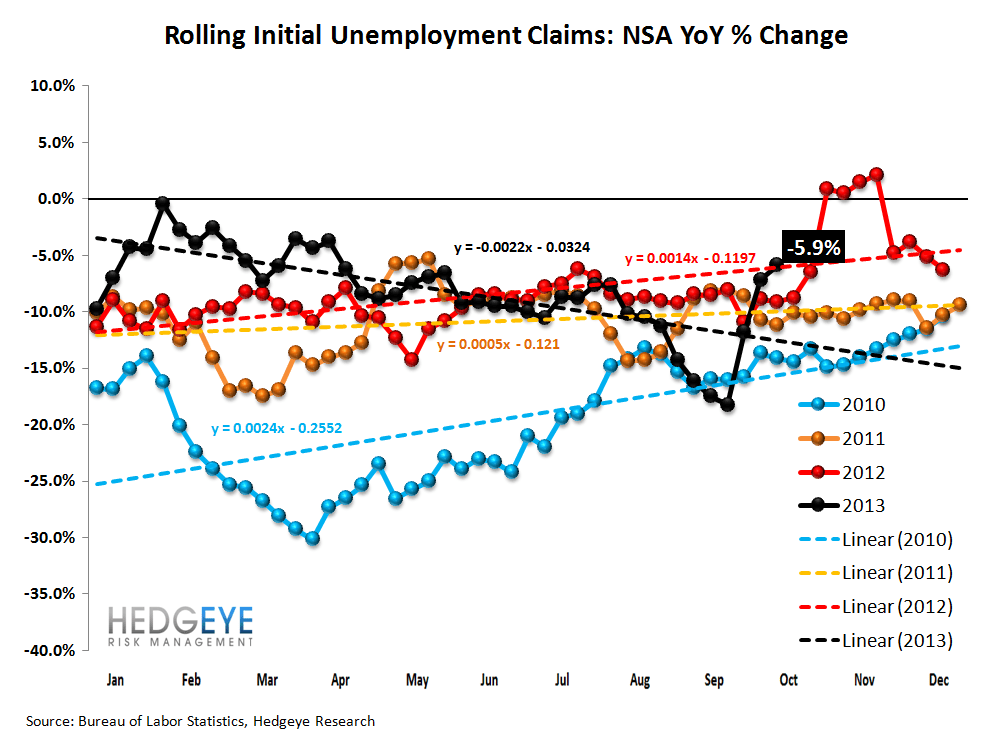
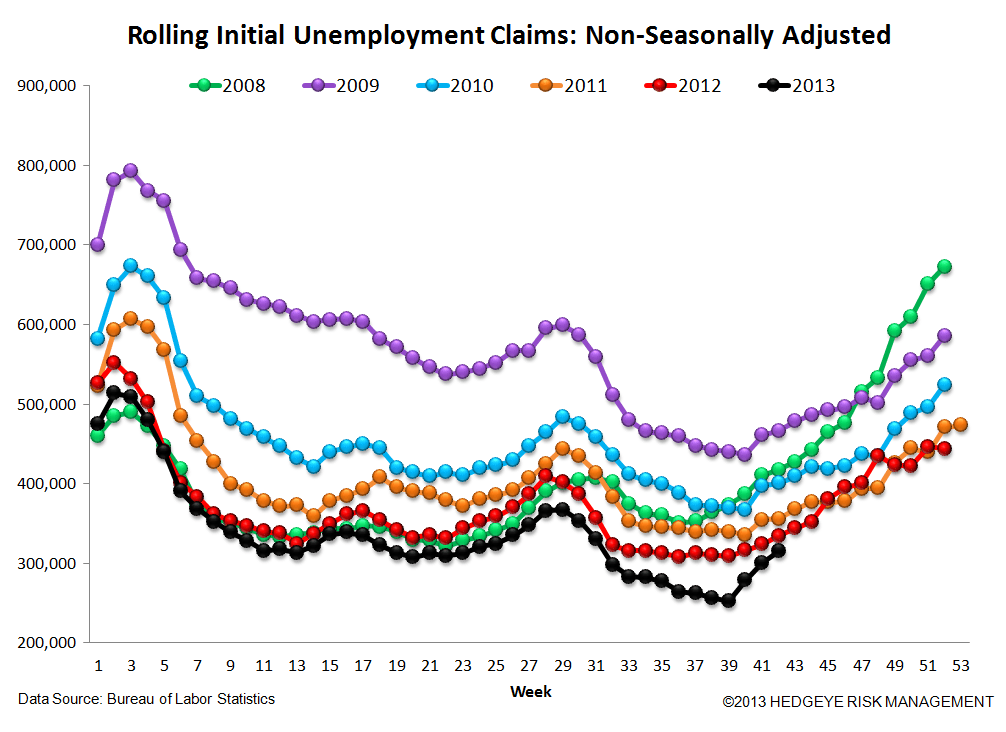
The 4-week rolling average of NSA claims, which we consider a more accurate representation of the underlying labor market trend, was -5.9% lower YoY, which is a sequential deterioration versus the previous week's YoY change of -7.2%


Yield Spreads
The 2-10 spread fell -15 basis points WoW to 219 bps. 4Q13TD, the 2-10 spread is averaging 229 bps, which is lower by 5 bps relative to 3Q13.


Joshua Steiner, CFA
Jonathan Casteleyn, CFA, CMT
