Investment Company Institute Mutual Fund Data and ETF Money Flow:
Equity mutual fund flow snapped back after soft trends after the gridlock in Washington recently with a $2.9 billion inflow for the 5 day period ending October 16th, a reversal from the prior week's outflow of $3.1 billion. Total equity mutual fund trends reflect the shift from fixed income and into stocks with a $2.5 billion weekly average inflow thus far in '13 versus 2012's $3.0 billion weekly outflow
Fixed income mutual funds trends have been consistent with persistent outflows. This week's tally was another $5.7 billion lost in the category, an acceleration from the week prior's $2.5 billion outflow and now sending 2013's weekly average fund flow to a negative $687 million. This compares to the weekly inflow from last year in 2012 of $5.8 billion for fixed income funds
ETFs were a source of funds last week, with outflows in both equity and fixed income products. Passive equity products experienced outflows of $1.5 billion for the 5 day period ending October 16th with bond ETFs losing $1.7 billion during the same time period. ETF products also reflect the 2013 asset allocation shift, with the weekly averages for equity products up year-over-year versus bond ETFs which are seeing weaker year-over-year results

For the week ending October 16th, the Investment Company Institute reported the first simultaneous inflow into both domestic and world stock products in 4 weeks to the tune of $2.9 billion. This $2.9 billion inflow for the most recent 5 day period broke out to a $839 million subscription into domestic equity products, the biggest inflow in 5 weeks into domestic stock funds. The other portion of the equity inflow was into world equity products which booked a $2.0 billion inflow, the best result in 4 weeks for foreign stock funds. The equity category has been a tale of two tapes recently with domestic equity funds having had outflows in 8 of the past 14 weeks compared to international equity funds which have had inflows every week in the past 14. Despite this weak run in domestic stock fund flows, the year-to-date weekly average for 2013 for all equity mutual funds now sits at a $2.5 billion inflow, a complete reversal from the $3.0 billion outflow averaged per week in 2012.
On the fixed income side, bond funds continued their weak trends for the 5 day period ended October 16th with outflows accelerating week-to-week. The aggregate of taxable and tax-free bond funds booked a $5.7 billion outflow, just over double the $2.5 billion in investor withdrawals from the week prior. Both categories of fixed income contributed to outflows with taxable bonds having outflows of $3.8 billion, which joined a $1.8 billion outflow in tax-free or municipal bonds. The taxable outflow in the most recent period, was the worst outflow in 6 weeks and the muni redemption was the largest in 5 weeks. While the sharp outflows that marked most of the summer and the start of the third quarter have moderated, the appetite for bonds has hardly rebounded. The 2013 weekly average for fixed income fund flows is now a $687 million weekly outflow, a sharp reversal from the $5.8 billion weekly inflow averaged last year.


Passive Products:
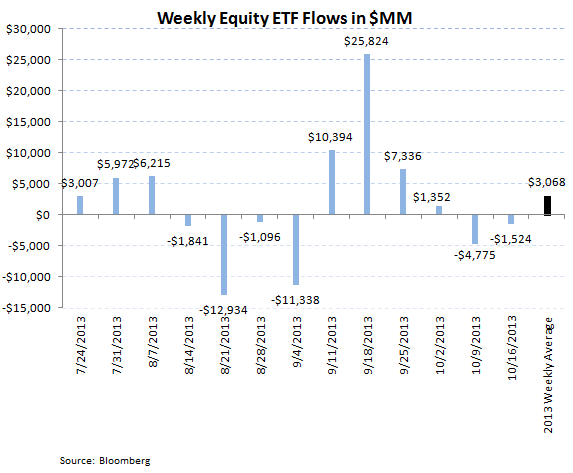
Exchange traded funds experienced soft trends last week with both equity and fixed income products booking marginal redemptions. Equity ETFs lost $1.5 billion in funds, an improvement from the $4.7 billion outflow the prior week. Despite these outflows the past two weeks within equity ETFs, the 2013 weekly average equity trends is averaging a $3.0 billion weekly inflow, an improvement from last year's $2.2 billion weekly average inflow.
Bond ETFs experienced another weekly redemption of $1.7 billion, the third week in a row of outflows and slightly worse than the $1.3 billion lost the 5 days prior. Including this most recent redemption within passive bond products, the 2013 weekly bond ETF average is flagging at just a $275 million inflow, much lower than the $1.0 billion average weekly inflow from 2012.

Jonathan Casteleyn, CFA, CMT
Joshua Steiner, CFA