Lots of Needed Adjustments
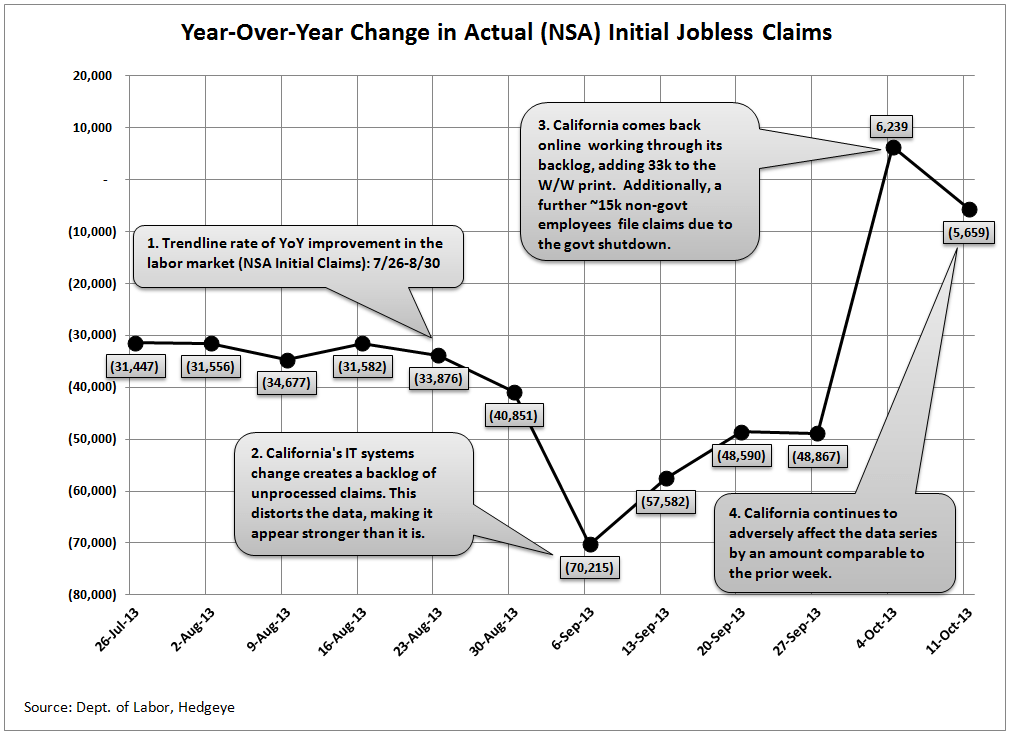
The Golden State has been the source of considerable and ongoing distortion in the only currently-available government labor market data series, initial jobless claims. We thought that last week's sharp spike in claims reflected the full catch-up of California's temporary IT systems-related issues, but that was wrong. This morning's number is again distorted by California's ongoing catch-up. While we received data last week indicating that there were 33k additional claims from California due to the backlog catch-up, this week we received no such number. Comments in the media, however, have alluded to the impact being of comparable size.
In the first chart below we look at the distortion being created with California and then in the second chart we examine the impact this is having on the national data. The first chart shows weekly NSA initial claims for CA through 10/4. Unfortunately, state level data is only available on a 1-week lag. The blue line shows 2013 while the red line shows the corresponding period in 2012. It's clear that the IT system effect occurred the week of Sep 6, when the spread between 2012 and 2013 jumped to -25k claims. The following week it remained wide at -21k. In the most recent week the spread reversed to +26k. However, it's the cumulative size of the distortion that now needs to be reversed. As such, we would expect next week's number to again be overstated. Thereafter, we would expect to see the series revert back to normal.
Separate from California's distortive effects, there is also the effect of the govt shutdown. While Federal employees file under a separate system (~70k of them filed the week of Oct 4), there are private workers who were laid off because they work in govt-related fields. These people were reported to have accounted for 15k additional claims in the week of Oct. 4. This past week no such similar disclosure was provided, but we did see reference from Reuters quoting a labor dept analyst saying "There had not been a perceptible increase in filings last week from non-federal workers furloughed because of the just-ended government shutdown."
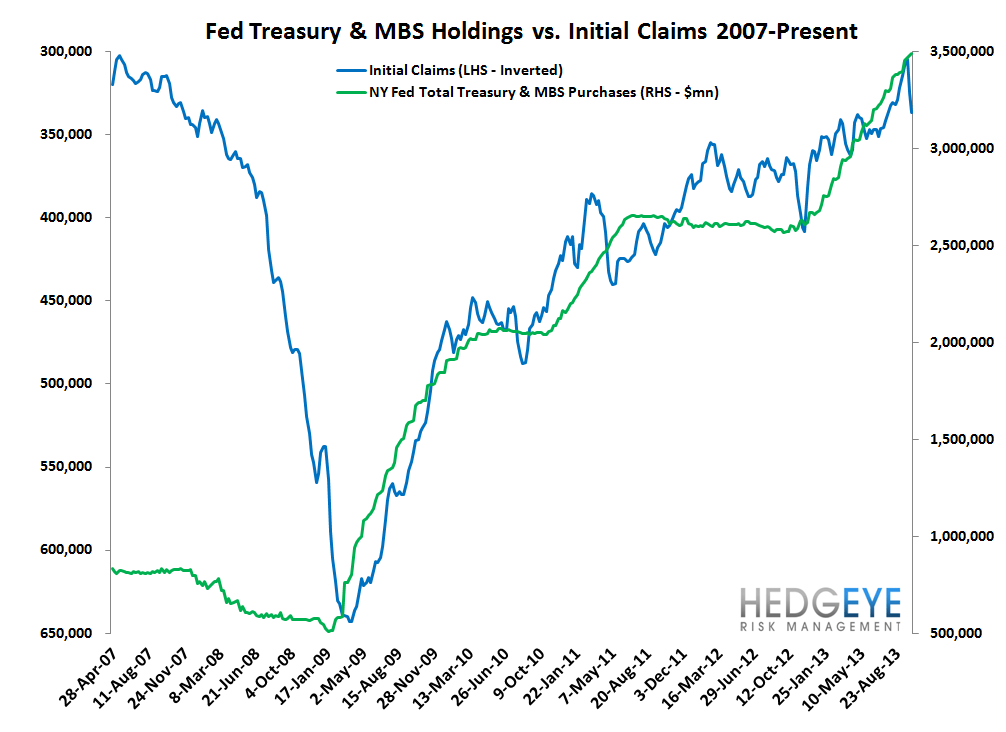
The bottom line is that when making the adjustments for both California and the temporary distortions from the govt shutdown, the labor market's trend line rate of improvement remains intact.

Nuts & Bolts
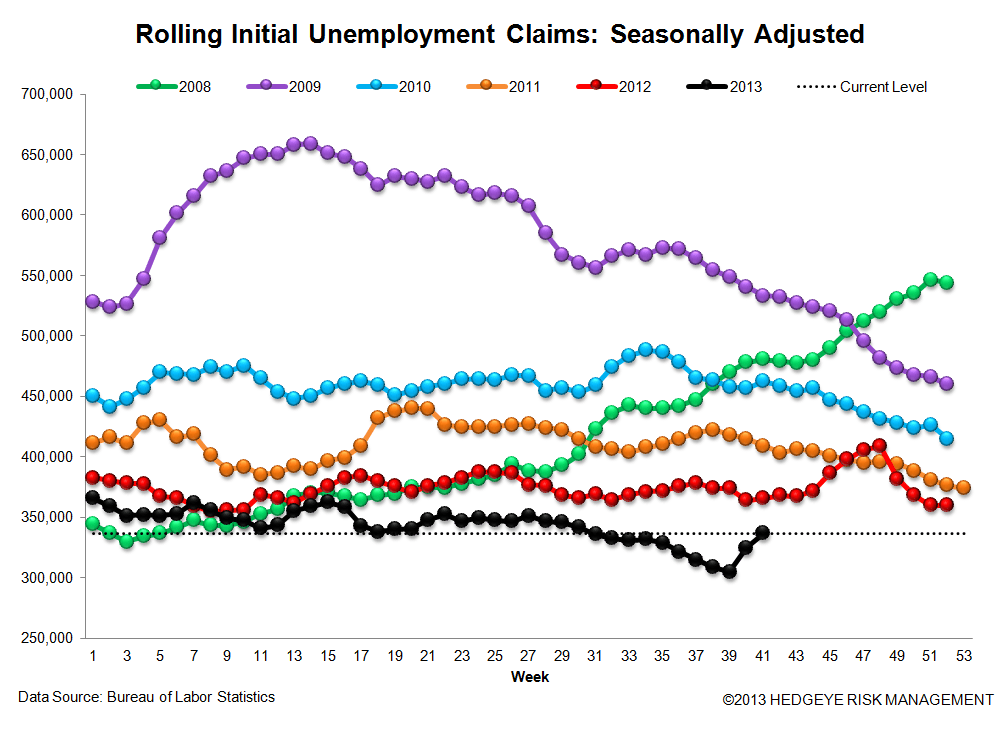
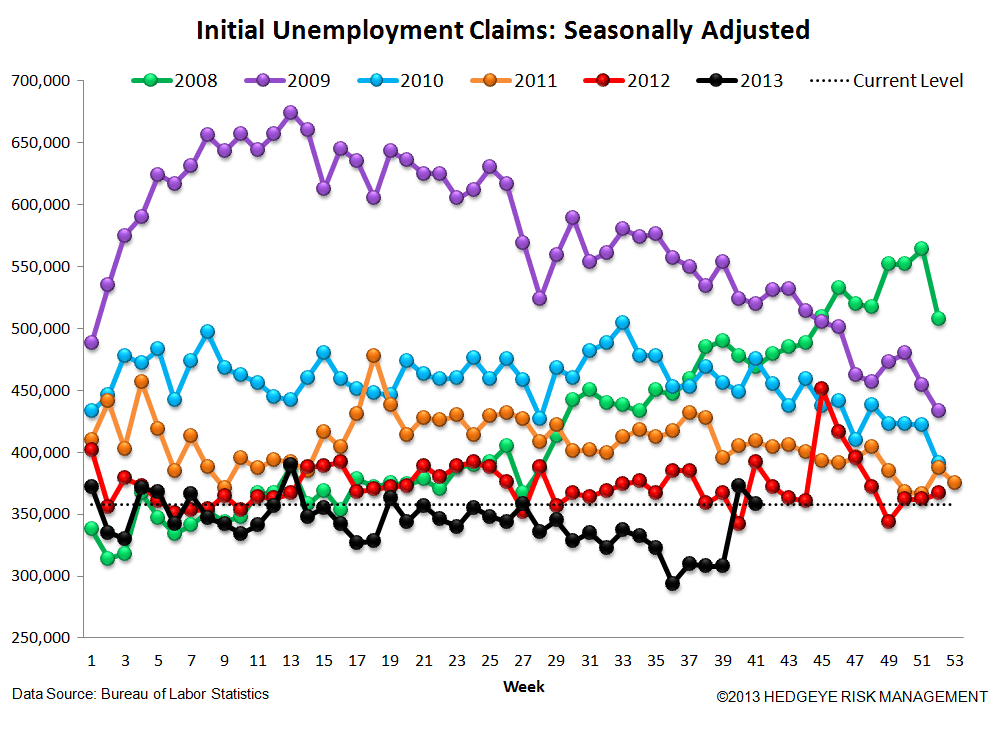
Prior to revision, initial jobless claims fell 16k to 358k from 374k WoW, as the prior week's number was revised down by -1k to 373k. Meanwhile, the 4-week rolling average of seasonally-adjusted claims rose 12k WoW to 336.75k.
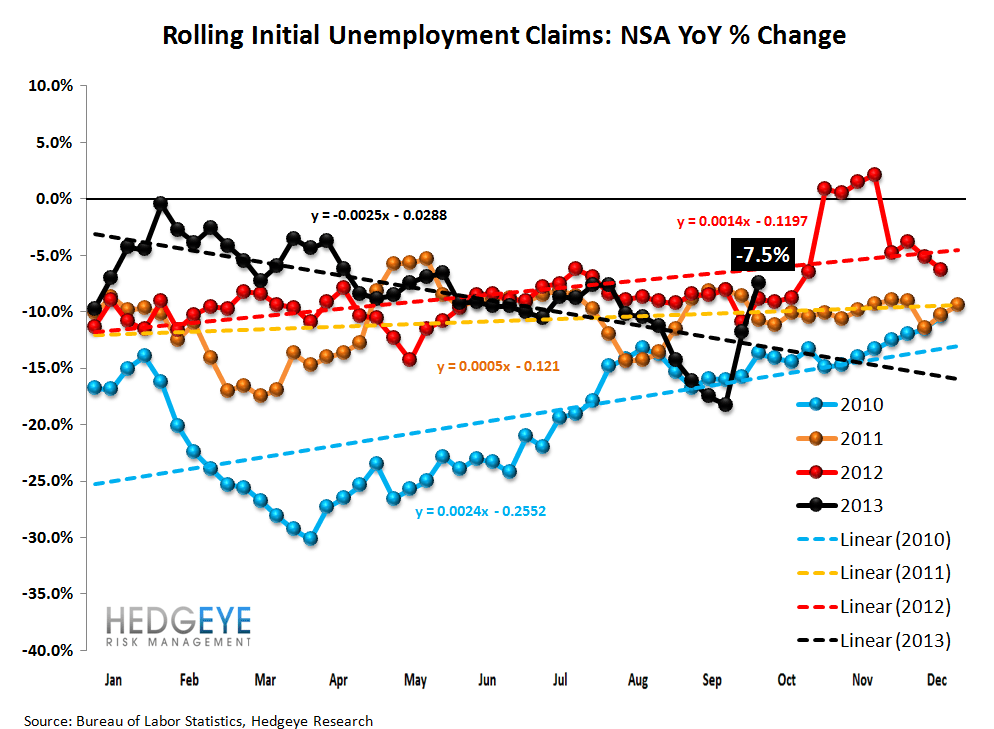
The 4-week rolling average of NSA claims, which we consider a more accurate representation of the underlying labor market trend, was -7.5% lower YoY, which is a sequential deterioration versus the previous week's YoY change of -11.8%, but again this is an unadjusted number.


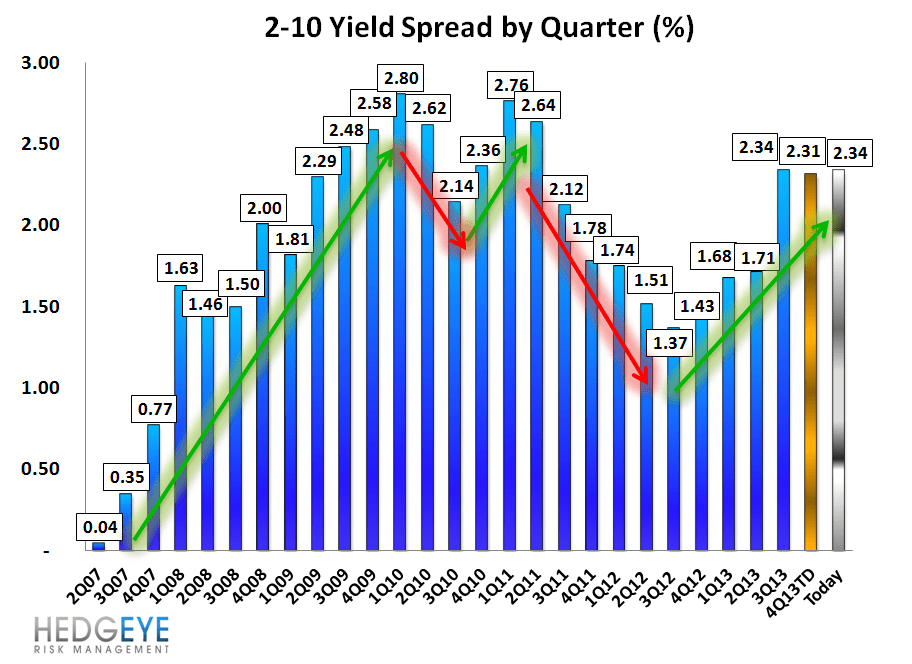
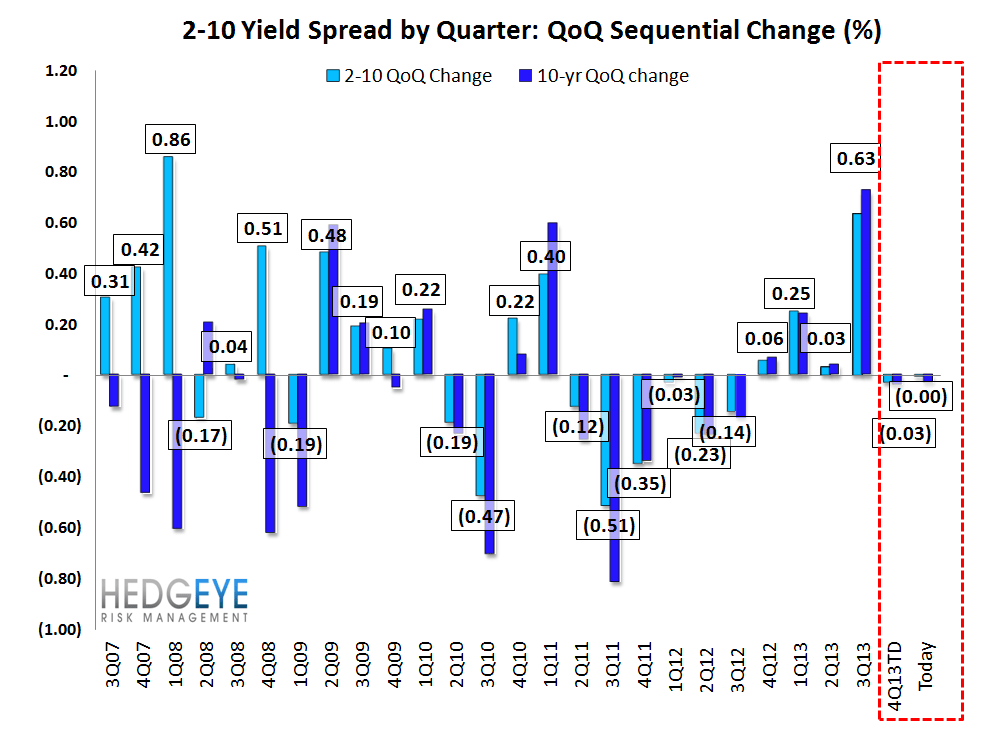
Yield Spreads
The 2-10 spread rose 4 basis points WoW to 234 bps. 4Q13TD, the 2-10 spread is averaging 231 bps, which is 3 bps lower relative to 3Q13.
Joshua Steiner, CFA
Jonathan Casteleyn, CFA, CMT
