Should We Care about the Tail or the Dog?
We would make two points with respect to this morning's labor market data.
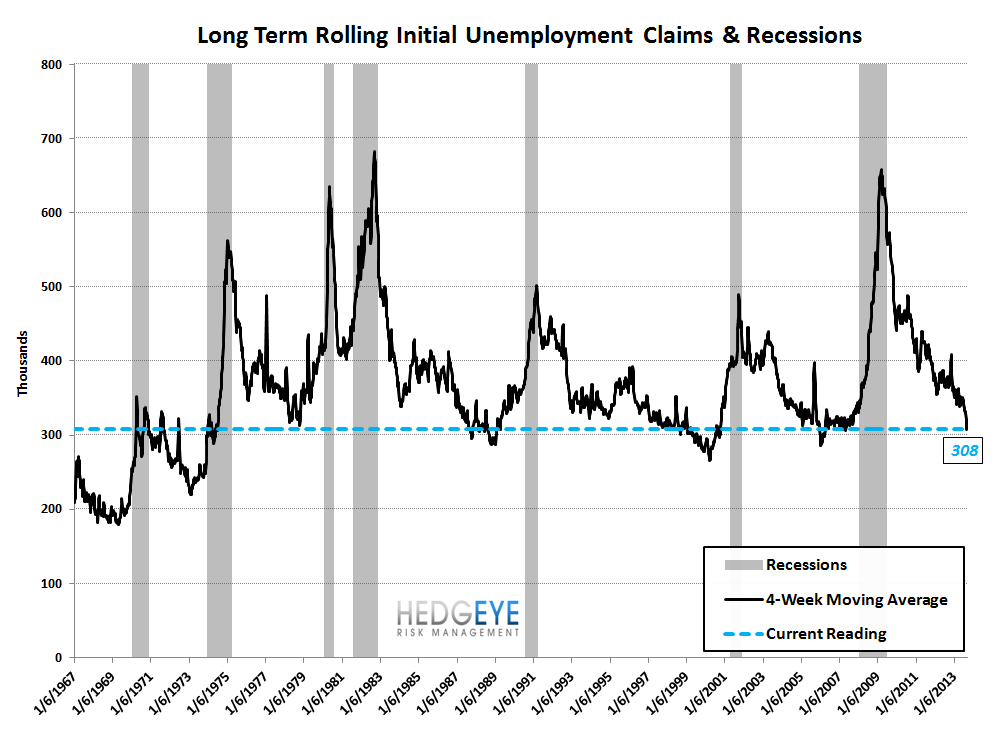
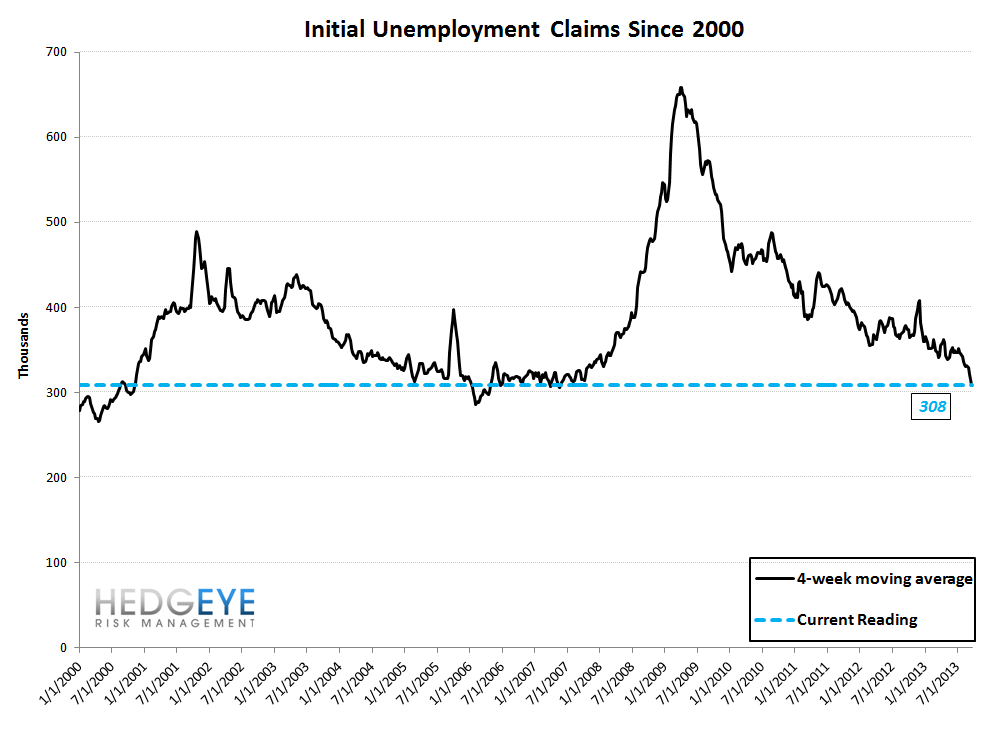
First, the data is exceptionally strong. For perspective, SA rolling initial jobless claims are now at levels last seen in April 1999 and January 2006. Recollect the market environment in both those periods. Consider the chart below.
Second, since the market seems obsessed with the NFP report that will come out next Friday, here are a couple thoughts on how claims do/don't relate to NFP.
a) The first chart below looks at the time series data back to the start of 1999. Rolling initial claims are in red on the left axis while private payrolls are in blue on the right axis and are inverted to make the relationship more apparent visually. We think that the visual makes it quite obvious that there is a relationship between these two series.
b) The second chart below shows the same data but on a scatterplot. The RSQ is somewhat low at 0.528, but nevertheless the relationship is still quite clear, we think. The blue series is monthly data from 1999 to Present, whiel the green box is the most recent data for August 2013. Just by coincidence, the most recent data pair was almost exactly on the pin of the regression line. This month's claims data, for reference, would suggest private payrolls of 195k for September, by the way. Unfortunately, the standard error is significant. It is too large to have much conviction in the accuracy of the estimate.
c) The final point worth making is that these two data series are cointegrated. The best definition I could find online for cointegration is the following: "The old man and the dog are joined by one of those leashes that has the cord rolled up inside the handle on a spring. Individually, the dog and the man are each on a random walk. They cannot wander too far from one another because of the leash. We say that the random processes describing their paths are cointegrated." - Link. We ran an ADF test (augmented dickey fuller) to see whether claims and NFP are, in fact, cointegrated and the p-value was 0.038. In other words, there is a 3.8% chance they are not cointegrated, and a 96.2% they are. Cointegration matters because it means that as claims go, eventually private NFP will go, just as the man with the leash will ultimately determine where the dog on the leash ends up.


The Data
Prior to revision, initial jobless claims fell 4k to 305k from 309k WoW, as the prior week's number was revised up by 1k to 310k.
The headline (unrevised) number shows claims were lower by 5k WoW. Meanwhile, the 4-week rolling average of seasonally-adjusted claims fell -6.75k WoW to 308k.
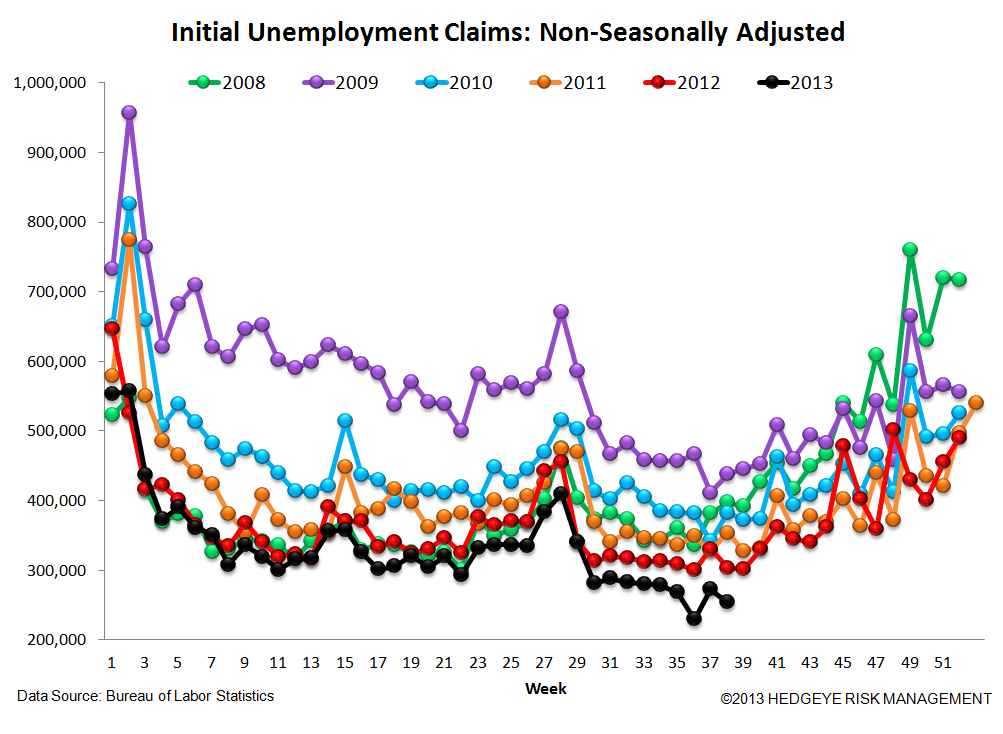
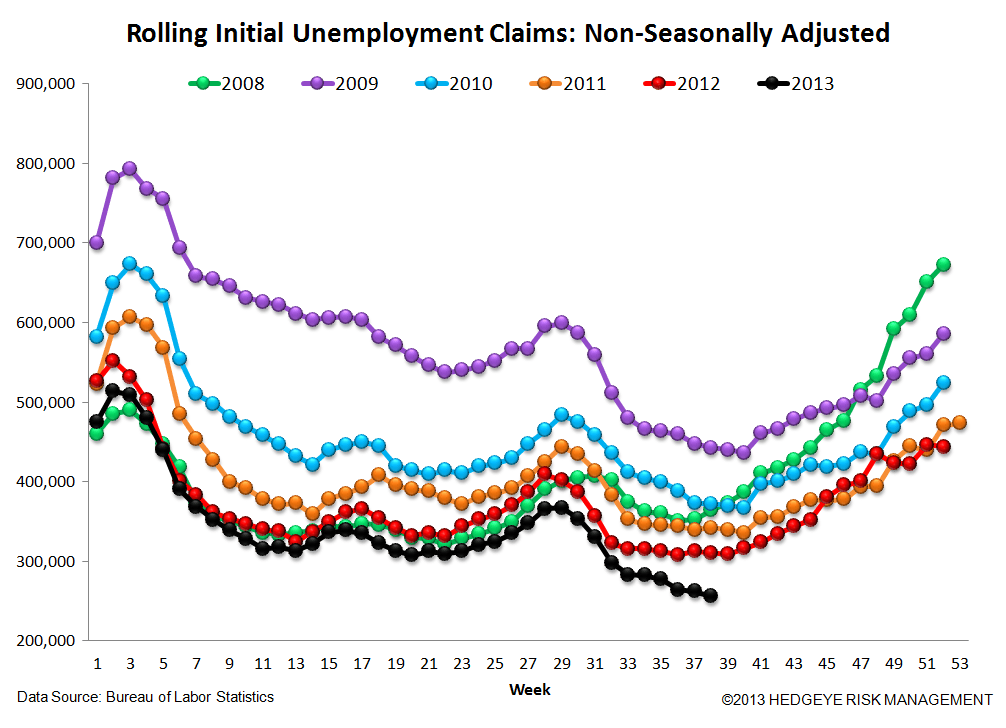
The 4-week rolling average of NSA claims, which we consider a more accurate representation of the underlying labor market trend, was -17.6% lower YoY, which is a sequential improvement versus the previous week's YoY change of -16.2%


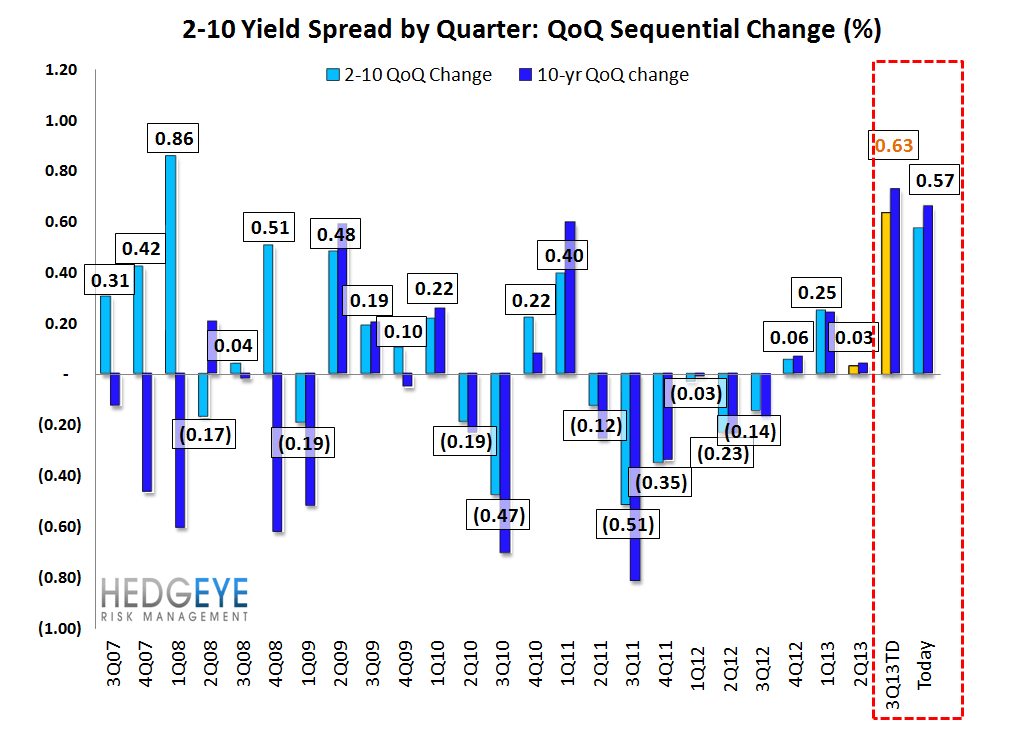
Yield Spreads
The 2-10 spread fell -8 basis points WoW to 228 bps. 3Q13TD, the 2-10 spread is averaging 234 bps, which is higher by 63 bps relative to 2Q13.

Joshua Steiner, CFA
Jonathan Casteleyn, CFA, CMT