TODAY’s DATA: Pretty from far, far from….(bad)
Superficially, both the seasonally-adjusted (292K) and non-seasonally adjusted claims (229K) data this morning were outstanding, with the respective series hitting new 7 and 13 year lows.
The headline strength was belied by the fact that both the labor day holiday and computer upgrades in two states, which apparently limited a fully tally in those states, served to artificially lower the reported figures.
The simple takeaway is that given this week’s data caveat, we’re inclined to just stick with broader trend. Last week’s claims data reflected the strongest rate of YoY improvement YTD and a new multi-year cycle low in the absolute figures. For perspective, even if NSA claims had been 38K higher and SA claims +42K higher than what was reported this week, we’d still be flat with last week’s rate of improvement in the 4-week rolling average.
Irrespective of today’s data, the Trend in claims has been one of accelerating improvement and both the market and 10Y bond yields continue to track the labor market strength higher.


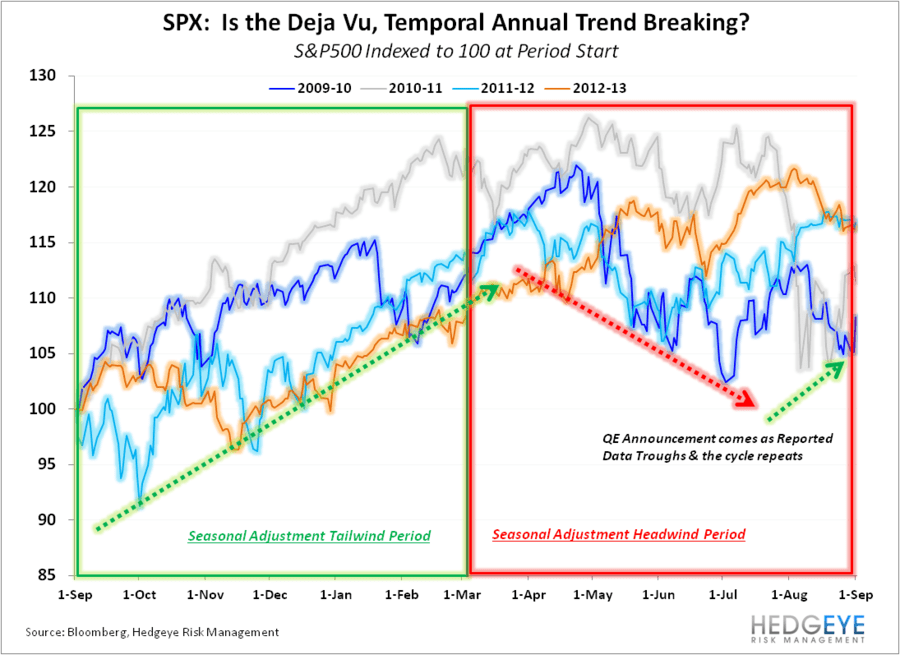
SEASONALITY: Its impacts have been pervasive, are we breaking the cycle in 2013?
Rather than debate the vagaries of today’s claims release, given that we’re now at the inflection point for seasonality, we thought it worthwhile to recap how seasonality has manifest in markets prices and investor psychology over the last four years.
To Review: As we’ve highlighted repeatedly over the last number of years, strong and quantifiable seasonal adjustments have had a meaningful impact on the temporal trend in reported economic & employment data over the last four years. In short, the shock in the employment series in late 2008 – early 2009 which occurred alongside the peak acceleration in job loss during the Great Recession was captured, not as a bona fide shock, but as a seasonal factor.
The net effect of this statistical distortion is that seasonal adjustments act as a tailwind from September – February, then reverse to a headwind over the March-August period. So, as we now move through September, seasonality will again transition to a data tailwind through 1Q14.
Below we (re)highlight how the reported macro data, equity market performance, investor sentiment and analyst estimates have all followed a similar annual, temporal pattern. With the Fed expected to pull back on easing in 3Q (whereas incremental easing had been implemented in 3Q in prior years) and the seasonal distortion having a diminishing impact in each successive year, it would be unsurprising to see some different or more muted iteration of the recurrent cycle in 2013-14 go 'round.
However, from a strategy perspective, and regardless of the monetary policy shift, the pattern is still worth remembering/being cognizant of as seasonality will again build as a support to the reported domestic macro numbers over the coming months.
Source: Hedgeye Financials


Christian B. Drake
Senior Analyst
