Friday’s jobs report was a mixed bag and the narrower data sets released this morning followed suit. The largest acceleration in employment growth came from the 20-24 YOA cohort, which suggests that sales at quick-service and fast casual restaurants are likely to remain strong through the rest of 3Q.
Highlighted in the following charts, there is a notable inverse correlation between rolling initial claims and the performance of stocks within our space.


Below, we discuss employment by age and restaurant industry employment. These serve as proxies for demand and operator confidence, respectively, in our models.
Employment by Age (demand)
Employment growth by age skewed negatively in August as the 20-24 YOA cohort saw growth accelerate to +338 bps from +205 bps in July, the 25-34 YOA cohort saw growth decelerate to +185 bps from +204 bps in July, the 35-44 YOA cohort saw growth accelerate to +59 bps from +53 bps in July, the 45-54 YOA cohort saw growth slow at an accelerating rate to -113 bps from -94 bps in July, and the 55-64 YOA cohort saw growth decelerate to +257 bps from +348 bps in July.
Employment by age is an important metric for the restaurant industry. Given the discretionary nature of casual dining expenditure, and the highly-competitive nature of the industry, we infer that sustained employment growth in core demographics is necessary for continued comp growth in the absence of new unit growth or income per capita growth. The sequential acceleration in growth slowing in the 45-54 YOA cohort and the deceleration in the 55-64 YOA cohort reflect negatively upon casual dining companies, indicating that we could see weakness persist within the sector.
Within the QSR segment, we continue to find that the majority of management teams we track are consistently highlight the importance of employment growth to the success of their business. The strong sequential acceleration in the 20-24 YOA cohort, offset marginally by the small deceleration in the 25-34 YOA cohort, should sit well with quick-service and fast casual restaurants.

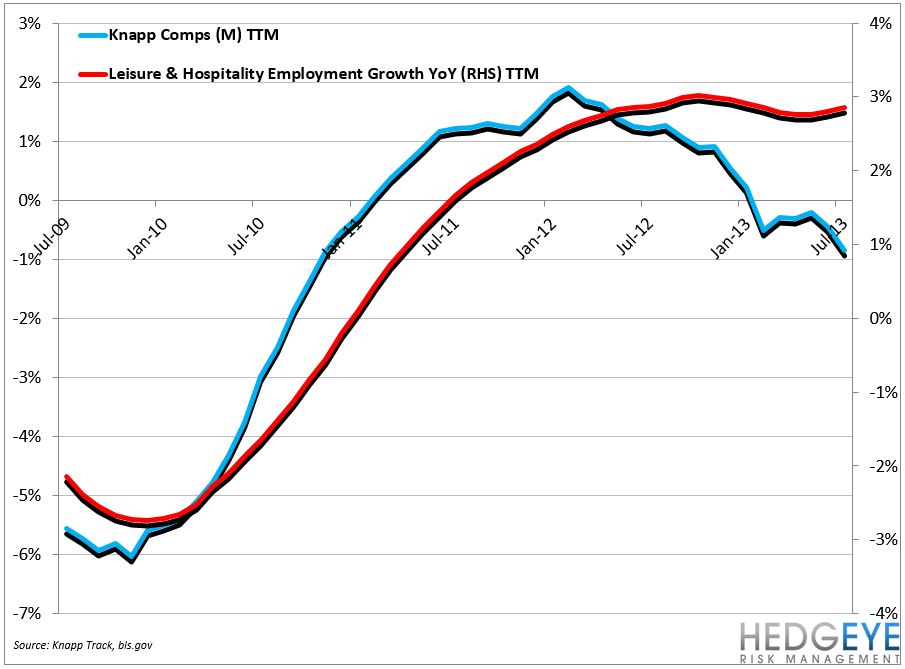
Restaurant Industry Employment (confidence)
The Leisure & Hospitality employment data, which leads the narrower food service data by one month, suggest that employment growth in the food service industry decelerated sequentially in August. Leisure & Hospitality employment data did, however, register a month-over-month gain of +27k (second chart below), an acceleration from July’s +13k month-over-month gain.
The more narrow restaurant-focused data sets paint a less clear picture. Limited-service employment growth decelerated sequentially in July, while full-service employment growth accelerated sequentially in July.
Sequential Moves
Leisure & Hospitality: YoY employment growth at +3.08% in August, down -14 bps versus July
Limited Service: YoY employment growth at +4.9% in July, down -3 bps versus June
Full Service: YoY employment growth at +2.97% in July, up +34 bps versus June


Howard Penney
Managing Director
