Investment Company Institute Mutual Fund Data and ETF Money Flow:
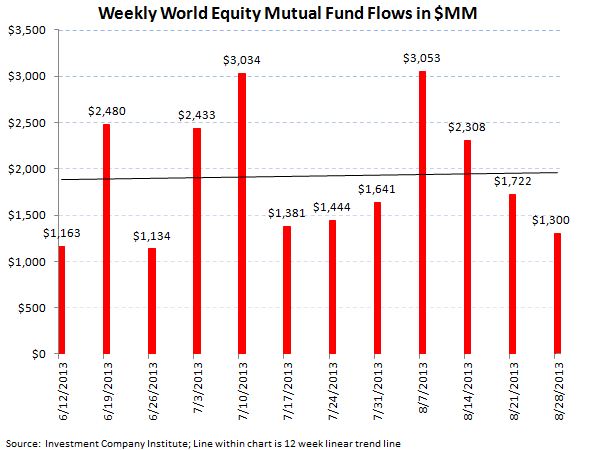
Equity mutual fund inflow slowed to a trickle or just $300 million for the week ending August 28th, down from the $1.3 billion inflow the week prior but remaining positive
Fixed income mutual fund outflows remained substantial with a $9.1 billion withdrawal by investors, a slight decline from the $11.1 billion draw down last week but remaining at out-sized levels
Within ETFs, both equity and fixed income exchange traded fund money flow was negative for the week ending August 28th with just over $1.0 billion coming out of passive equity products and over $900 million coming out of passive bond products although both outflows were improvements from the week prior


For the week ending August 28th, the Investment Company Institute reported softening equity mutual fund flow trends, albeit positive flow trends, and continuing out sized withdrawals in fixed income mutual funds. Total equity fund flow totaled just a $300 million inflow which broke out to a $1.3 billion inflow into international equity products and a $1.0 billion outflow in domestic stock funds. These trends were a softening from the prior week's total equity fund inflow of $1.3 billion. Despite this deceleration in stock fund flows, the year-to-date weekly average for 2013 now sits at a $2.6 billion inflow for total equity mutual funds, a substantial improvement from the $3.0 billion outflow averaged per week in 2012.
On the fixed income side, outflow trends continued at exaggerated levels for the week ending August 28th with the aggregate of taxable and tax-free bond funds combining to lose $9.1 billion in fund flow, the fourth biggest weekly draw down in 2013 in what now has become the biggest bond withdrawal in the history of the ICI data. The taxable bond category specifically shed $6.2 billion in the most recent period versus the $7.3 billion loss last week. Tax-free or municipal bonds continued their sharp outflow trends losing another $2.9 billion in the week ending August 28th, continuing its trend from last week which experienced a $3.7 billion outflow. Franklin Resources (BEN) continues to have the most exposure in our coverage group to declining Municipal bond trends with over 10% of its assets-under-management in the tax-free category. The 2013 weekly average for fixed income fund flow has now drastically declined from 2012, now averaging a $136 million weekly outflow this year, a far cry from the $5.8 billion weekly inflow averaged last year.
Hybrid funds, or products that combine both fixed income and equity allocation, continue to be the most stable category bringing in another $1.1 billion in the most recent weekly period. The year-to-date weekly average inflow for hybrid products is now $1.6 billion for '13, almost a 100% increase from 2012's $911 million weekly average.


Passive Products - Slight Outflows Across the Board:
Both categories of exchange traded funds experienced redemptions by investors for the week ending August 28th. Equity ETFs lost $1.0 billion, rebounding from the biggest equity ETF outflow in 5 years of over $12.0 billion last week and only the 10th negative week in the 35 weeks of 2013. Despite this week's outflow, 2013 weekly average equity ETF trends are averaging a $3.0 billion weekly inflow, an improvement from last year's $2.2 billion weekly inflow average.
Bond ETFs also had soft trends in the most recent weekly period losing over $900 million in fund flow. This outflow was a slight improvement from last week's $2.3 billion withdrawal and has now forced the 2013 weekly average to just a $284 million inflow for bond ETFs, much lower than the $1.0 billion average weekly inflow from 2012.


HEDGEYE Asset Management Thought of the Week - The Shift Change is On:
For investors that are still defiant that an asset allocation rotation has not started need to look no further than the weekly money flow trends since the start of May. While equity mutual fund and ETF inflow on a weekly basis has slowed from the usual seasonally fast start to the year, stock fund flow has remained solidly positive through the most recent week to end the summer. Conversely, fixed income mutual fund and ETF trends on a weekly basis have taken a sharp turn for the worse and are now in massive weekly redemption through the most recent week.
Up until the week ending May 22nd this year, fixed income fund and ETF products were averaging over a $5.9 billion weekly inflow. Since the end of May however, fixed income trends have cascaded down sharply and since the 3rd week of May have averaged a massive $8.5 billion outflow. While the single week of June 26th represented the biggest weekly bond outflow in history of over $31 billion is skewing the weekly average on the margin, fixed income trends have been persistently negative on a weekly basis since the end of May. On the flip side, equity trends have been consistently positive albeit slowing into the summer period. For equity mutual funds and stock ETFs, weekly flow trends have been averaging a $3.2 billion inflow since May 22nd after averaging a $7.3 billion inflow weekly prior to the Fed's "tapering" comments before the week ending May 22nd this year. While all fixed income dollars drawn down are not being replanted one-for-one back into the equity markets, we do estimate that over time the reallocation from fixed income and into cash and money markets will continue to fuel a slow turn from the generational 30 year run in bonds into higher investor asset allocation into stocks.

Jonathan Casteleyn, CFA, CMT
Joshua Steiner, CFA
