Investment Company Institute Mutual Fund Data and ETF Money Flow:
Equity Mutual Fund inflow slowed to $1.3 billion for the week ending August 21st, essentially flat from the $1.4 billion inflow the week prior but remained positive
Fixed Income Mutual Fund outflows picked up substantially with an out-sized $11.1 billion withdrawal by investors, a much larger draw-down than just the $3.9 billion outflow from last week
Both Equity and Fixed Income ETF money flow was negative for the week ending August 21st with a substantial $12.9 billion coming out of passive Equity ETFs and $2.3 billion coming out of passive Bond exchange traded funds


For the week ending August 21st, the Investment Company Institute reported softening equity mutual fund flow trends, albeit positive flow trends, and accelerating week-over-week declines in fixed income mutual funds. Total equity fund flow totaled a $1.3 billion inflow which broke out to a $1.7 billion inflow into international equity products and a $387 million outflow in domestic stock funds. These trends essentially matched the week prior's combined inflow for domestic and international equity flows of $1.4 billion. Despite this deceleration in stock fund flows, the year-to-date weekly average for 2013 now sits at a $2.7 billion inflow for total equity products, a substantial improvement from the $3.0 billion outflow averaged per week in 2012.
On the fixed income side, outflow trends worsened during the week with the aggregate of taxable and tax-free bond funds combining to lose $11.1 billion in fund flow, the third biggest weekly draw down in 2013 in what now has become the biggest bond withdrawal in the history of the ICI data. This week's outflow was 3rd worst of the year lagging behind only the redemption in week ending June 26th of $28.2 billion and the week of June 12th where $13.4 billion was pulled out of fixed income funds. The taxable bond category specifically shed $7.3 billion in the most recent period versus the $1.8 billion loss last week. Tax-free or municipal bonds continued their sharp outflow trends losing another $3.7 billion in the week ending August 21st, a drastic acceleration from the $2.0 billion lost last week. Franklin Resources (BEN) continues to have the most exposure in our coverage group to declining Municipal bond trends with over 10% of its assets-under-management in the tax-free category. The 2013 weekly average for fixed income fund flow has now drastically declined from 2012, now averaging just a $128 million inflow this year, a far cry from the $5.8 billion weekly inflow averaged last year.
Hybrid funds, or products that combine both fixed income and equity allocation, continue to be the most stable category bringing in another $1.1 billion in the most recent weekly period. The year-to-date weekly average inflow for hybrid products is now $1.7 billion for '13, almost a 100% increase from 2012's $911 million weekly average.


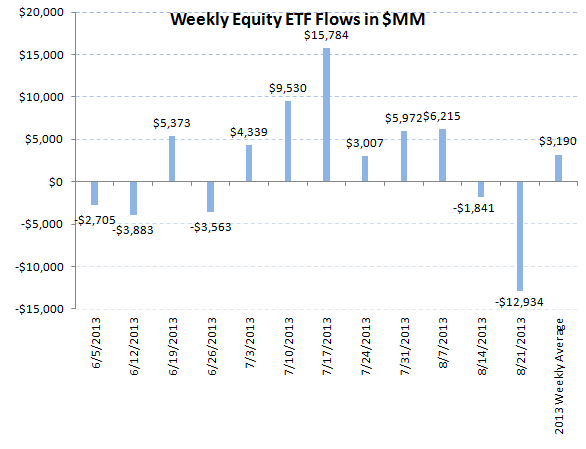
Passive Products - Worst Equity ETF Outflow for 2013:
Both categories of exchange traded funds experienced redemptions by investors for the week ending August 21st. Equity ETFs lost a substantial $12.9 billion, the biggest equity ETF outflow since last summer and only the 9th negative week in the 34 weeks of 2013. Despite this week's outflow, 2013 weekly average equity ETF trends are averaging a $3.1 billion weekly inflow, an improvement from last year's $2.2 billion weekly average.
Bond ETFs also had tough trends in the most recent weekly period losing $2.3 billion in fund flow. This outflow was a vast acceleration from last week's small $209 million withdrawal and has now forced the 2013 weekly average to just a $320 million inflow for bond ETFs, much lower than the $1.0 billion average weekly inflow from 2012.

HEDGEYE Asset Management Thought of the Week - Past is Prologue:
The setup for a rotation from bond funds into equity funds is following the same pattern as the last "Great Rotation" from stocks and into bonds in 2008 and 2009. In 2008, with the ongoing destruction of equity capital within the Credit Crisis and numerous financial concerns being forced to merge to avoid bankruptcy, stock funds experienced substantial outflows of over $59 billion in '08. These redemptions started the "parking" of funds in money market funds which experienced an abnormally high inflow level of $594 billion. This started the slow reallocation into bonds with 2008 spurring a $38 billion inflow into fixed income funds. In 2009 however, the rotation was completely on with another $3 billion leaking out of stock funds and a massive $504 billion being pulled out of money funds for a re-allocation of $323 billion into bonds. Thus history has told us that the first allocation move by investors will be into money funds and then into the new preferred asset class.

The setup of this rotation is again playing out in 2013 with fund flow data from the week ending May 22nd (when the Fed first mention the possibility of reducing its quantitative easing program) through this week's recent data at the end of August, again showing preference for outflows in the most troubled asset class (in this cycle being bonds), the parking of funds into money funds, and then a slow rotation into the asset class with the highest return potential (stocks in this cycle). This 12 week stanza of information has shown a $99 billion outflow in fixed income (now the largest bond withdrawal in history), a $34 billion inflow into money funds, and an $21 billion infusion into all equity funds (both domestic and international categories). With the disproportionate risks we see in the bond market currently, we estimate that this fund flow action will be the boiler plate for the rest of '13 and into 2014.

Jonathan Casteleyn, CFA, CMT
Joshua Steiner, CFA