“Does man live from inside out or from outside in?”
-Erich Maria Remarque
I just got back from Thunder Bay and have that quote underlined in a post WWI German inflation novel that one of our clients in London gave me – The Black Obelisk. When I read it, I immediately thought of Global Macro investing legend, Ray Dalio.
Dalio’s signature quote about risk management is also a question: “What is the truth?” And whether it’s his, pardon the pun, All-Weather Fund’s issues, or performance problems most of us have faced over the course of our careers, there’s one thing that tends to answer all the questions we never knew we should have asked – it’s called volatility.
The number one thing that has created draw-down risk in every major hedge fund strategy since the beginning of time has been, and will continue to be, volatility. If your strategy assumes the wrong volatility parameters, you are assuming risks that you do not understand. On a percentage basis, did the biggest q/q change in 50 years in Treasury yields matter? Big time.
Back to the Global Macro Grind…
Slides 15, 16 and 17 of our current #RatesRising Global Macro Theme deck outlined how massive outflows from Fixed Income related securities plays out:
1. Quantitative Signal (Slide 15) – we show what we coined “The Waterfall” of rate risk as 10yr US Treasury Yields broke out across all three of our core risk management durations (TRADE, TREND, and TAIL – with the TAIL risk line = 1.92%)
2. Causal Factor (Slide 16) – we show how unconventional Fed policy exacerbated a bond bubble (Fed Balance Sheet vs 10yr Yield over the last 10 years = R-square of 0.795)
3. Correlation Factor (Slide 17) – we show that on a % basis, the most recent rate of change in the 10 year US Treasury Yield (quarter-over-quarter) was the largest in the last 50 years
Call us lucky or call us right. The truth is that we cut our asset allocation to Fixed Income to 0% for the aforementioned reasons alongside many more that were driving a regime change in terms of how our model values growth versus slow growth allocations.
When we were bearish on growth (until November of 2012) we were long US Treasuries; when our views on the slope of growth changed from slowing to stabilizing, we started to move to the dark side (in bonds).
#Process review:
- We get the market signal
- We do the long-cycle research to find asymmetric (phase change) risks
- We wait for the market to tell us when causal factors (expectations changes) drive correlation risk
This is no victory lap. I just feel that it’s important to show people what it is that we do in a transparent, open, and accountable forum of debate. The only all-weather protection against volatility ripping is getting out, before it rips.
Throughout the last 9 months (as US growth went from slowing to stabilizing to accelerating) markets have provided us plenty of opportunity to get into growth related asset classes and out of slow growth ones. August to-date is no different:
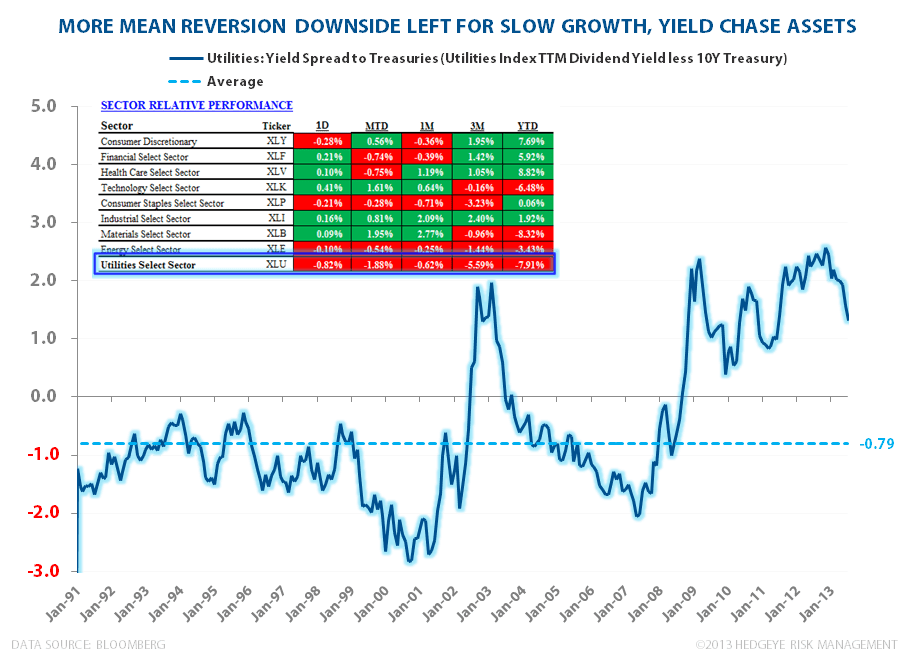
1. Utilities (XLU) are the most overvalued slice of the slow-growth equity pie (with hyper-overvalued securities like MLPs within this Sector Style Risk). XLU is down -1.38% for August to-date (versus SPY +0.5%)
2. Tech (XLK) and Basic Materials (XLB) are up the most for August to-date at +2.11% and +2.45% respectively. Both are traditionally considered “growth” sectors but for very different reasons. AAPL is not CAT.
There’s a lot of risk in assuming that long-cycle cyclicals (like mining related stocks) are in the right spot from a “growth” investor’s perspective. Then there’s GARP (“growth at a reasonable price”) where mining stocks might look “cheap” too. Just don’t forget that the Mining Capex Cycle was a decade long bubble. The risk here is grounded in the volatility of the underlying commodities.
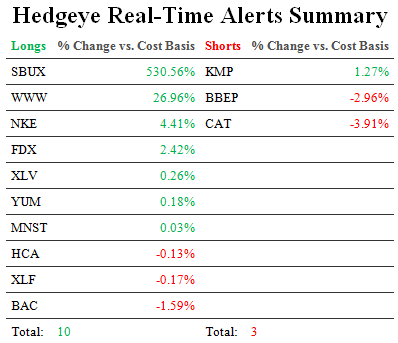
Where could we be wrong? Our research on something like Caterpillar (CAT) has been bearish, but now the market signal is stress testing our conviction in maintaining that position. If CAT were to close above my long-term TAIL risk line of $88.67 and hold that level on some real volume, my risk management process stops me out of the position.
Do I live my market life from looking inside our portfolio of ideas or from the outside looking in? The truth is that I do both. It’s a learning process. Whenever I ignore the outside, top-down, macro market signals, I will be reminded that volatility lives on the other side of my position’s underlying assumptions. And not in a good way.
Our immediate-term Risk Ranges are now:
UST 10yr 2.64-2.75%
SPX 1
VIX 11.61-13.68
USD 80.92-82.18
Gold 1
Copper 3.23-3.39
Best of luck out there today,
KM
Keith R. McCullough
Chief Executive Officer