This note was originally published July 12, 2013 at 12:11 in Financials
(Editor's note: Hedgeye's Institutional Clients range from the country's largest mutual funds to the world's top hedge funds. For more information on Hedgeye's Institutional Research product offerings, please click here.)
Lateral Plays
JPM read throughs. We see Capital One (COF) as a clear winner when they report 2Q next week. The card results from JPM confirm our perception of accelerating underlying improvement in credit quality in the unsecured market. Also, the enormous Q/Q improvements in residential RE credit quality trends bode well for BofA (BAC) when they report next week.
Results Are Stronger Than They Appear
JPMorgan reported a strong second quarter (all things considered), a blueprint for how we expect the rest of earnings season to progress. That said, there are many size-able adjustments that bulls and bears alike can find plenty to like or take issue with in this report. Here's our take.
The printed number was $1.60 vs. the Street at $1.44. There’s lots of adjustments here, so let’s dig in.
- First, the company posted a whopper of a reserve release at $1.356bn, or 23 cents per share. Consensus was looking for $1.26bn, or 21 cents per share . As such, that delta only accounts for 2 cents vs. Street numbers.
- Second, the company posted a DVA benefit of 6 cents or $355mn from spreads widening. This is a tough one to make apples to apples adjustments to because, while we know there's a DVA benefit in the consensus estimate, we don't know how large it is.
- Third, they posted a 9 cent ($600mn pretax) charge for boosting litigation reserves.
Net, net we get to $1.60 less 2 cents (reserve release delta vs consensus) less 6 cents (DVA) = $1.52. Finally, if we give them the 9 cents in litigation reserve they pop back up to $1.61, and, if not, they stay at $1.52. Either way, they seem well ahead of the $1.44 estimate. Also, recall that the $1.44 already included some degree of DVA tailwind, so the true apples to apples number is likely stronger still.
Moving past the adjustments, here is a quick summary of some of the other notable items we spotted this quarter:
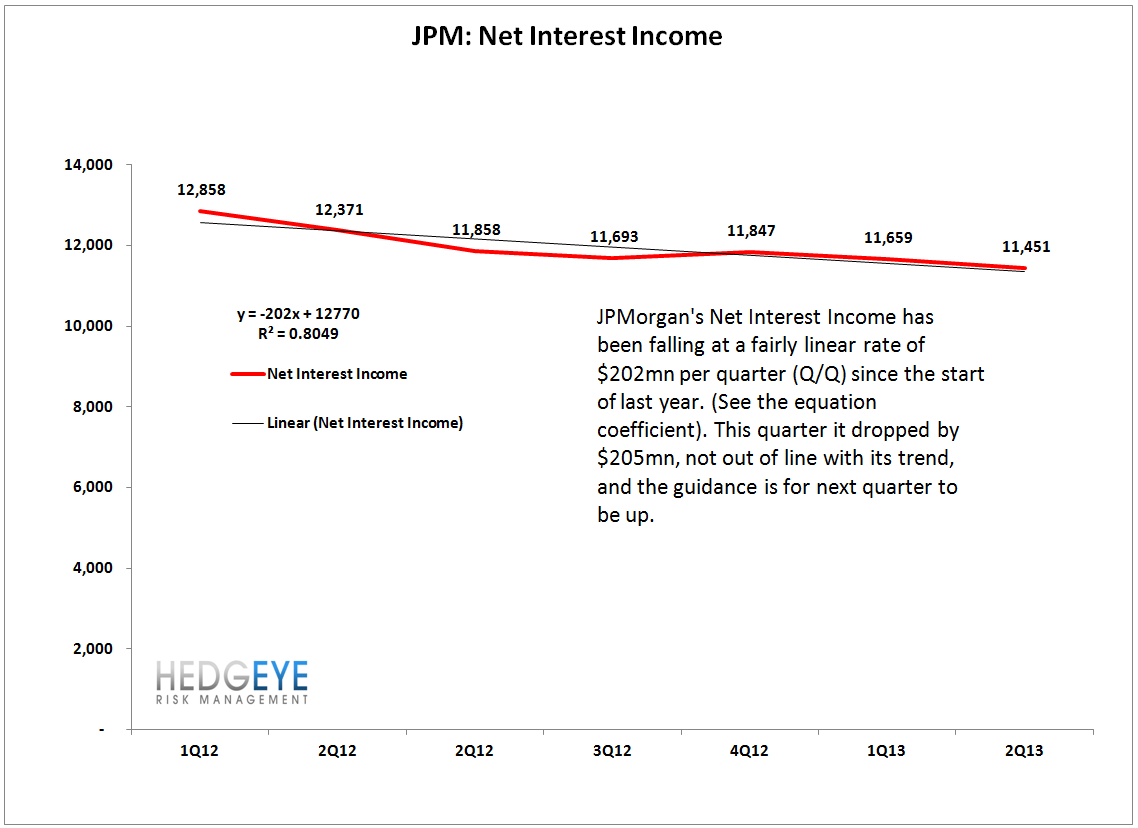
- NIM down 17 bps QoQ to 2.20% from 2.37%. Much of the decline was attributable to the company boosting cash levels by over $100 billion to meet LCR requirements. The interesting takeaway is that while NIM was down 7.2% Q/Q, Net Interest Income was down a much more benign 1.8% Q/Q. Also, taking a step back, if we look at the 7-quarter trend, we find that NII has been falling at trend-line rate of $202mn per quarter (Q/Q). This quarter's sequential decline of $208mn was essentially right in line with that trend. We're not cheering this as good news, but it is an important context factor relative to what appears to be horrible sequential performance in the NIM. Also, it's worth noting that the forward outlook is for stabilizing NIM in the back half and for NII to be sequentially higher in 3Q vs 2Q. For reference, in the last 7 quarters, NII has only advanced Q/Q once (4Q12).
- Loan growth was negative 50 bps Q/Q. The outlook is for loan growth to begin to accelerate in the back half of the year as the company is reporting seeing early signs of a modest resurgence in loan demand.
- Non-interest income was again strong this quarter, even after adjusting for DVA benefits. Clearly the Investment Banking business delivered stronger than expected results and Mortgage Banking held steadier than expected under the circumstances. Looking forward, the company clearly tempered expectations on the mortgage side, indicating that the current rate environment would lead to a 30-40% reduction in mortgage volume over the back half of the year.
- Efficiency was up Q/Q, rising to 61.1% from 59.7%, but is continuing its trend-line improvement since the start of last year. Looking back over the last 7 quarters, the company has driven efficiency lower by 1% per quarter (Q/Q).
- Credit quality was impressively strong this quarter. Supporting the massive reserve release, the company’s NPAs and NPLs were down, 4 and 9 bps, respectively. Meanwhile, coverage remained at 199% of NPLs in spite of the drawdown (flat with last 4 quarters).
- Tangible book value per share advanced this quarter to $40.04 from $39.54 last quarter, and, importantly, has grown 12.1% in the last 12 months. This is in spite the London Whale fiasco. This quarter, the company posted a 13% return on equity and a 17% return on tangible equity.
- Leverage Ratio - Yesterday's fanfare over the new supplementary leverage ratio requirements looks like it won't be a terribly big event for JPMorgan. To put things in context, the company is currently at a 4.7% leverage ratio under the new framework with a BHC requirement to get to 5% by 1Q18. They are generating a 16-17% return on tangible capital right now. If we gross up their capital base by 6% (5.0% / 4.7% = 106%), we find that that potential return on tangible equity compresses by roughly 100 bps, i.e. from 17% to 16%. On a fair value model for banks, a 100 bps compression in potential ROTE equates to roughly an 8% reduction in multiple to tangible book value. 8% of JPMorgan's $40 TBVPS = $3. However, based on the company's 16-17% ROTE, we estimate fair value is actually closer to 2x tangible book value (on a straight P/TBVPS : ROTE model (y = 9.4098x + 0.492) and on an EVA model (+3.2%) we estimate fair value is 1.73x TBVPS (y = 8.2686x + 1.4679), or $70-80 per share. So a $3 reduction in potential fair value seems de minimis relative to $15-25 upside.
- Capital Return - The dividend was increased to 38 cents (2.7% yield) from 30 cents (2.2%) and the outlook for buyback remains unchanged.
The charts below look at the trends in net interest income, tangible book value growth vs. price and returns, the current relationship of return on tangible capital to price/tangible book value (good), the current relationship between EVA and price to tangible book value (better), the current upside/downside to fair value by bank based on our EVA model, and, finally, the 2Q earnings snapshot.


Joshua Steiner, CFA
203-562-6500
jsteiner@hedgeye.com
Jonathan Casteleyn, CFA, CMT
203-562-6500
jcasteleyn@hedgeye.com
